
How to Assess Competitor Audience Overlap
Measure shared vs. unique visitors, visualize overlaps with Venn diagrams, and uncover untapped audiences to grow market reach.

Competitor audience overlap shows how many of your visitors also check out competitor sites. This data helps you:
- Identify shared customers and refine strategies to stand out.
- Spot untapped audiences who visit competitors but not your site.
- Track loyalty and retention by comparing exclusive vs. shared visitors.
- Find advertising and partnership opportunities by analyzing user behavior.
For example, in March 2026, Nike and Adidas had 2.8 million shared visitors, signaling direct competition. Tools like Similarweb and Semrush let you measure overlap, calculate metrics, and visualize data using Venn diagrams. By tracking these insights, you can adjust marketing efforts, target new segments, and stay ahead in your market.
TUTORIAL: Audience Overlap Tool
Why Measure Competitor Audience Overlap
Measuring audience overlap gives you a better understanding of your total addressable market (TAM). It highlights the unique visitors engaging with competitors in your space and pinpoints how many potential customers you're not yet reaching. This insight helps you figure out whether you're operating in a saturated market or if there are untapped opportunities waiting to be explored.
A high overlap means you're going head-to-head with competitors. In this case, refining your messaging becomes critical. Low overlap, on the other hand, points to untapped audiences - groups your competitors have reached, but you haven't. These audiences represent clear opportunities for growth and expansion.
Audience overlap analysis also helps you spot potential threats early. By tracking which competitors are drawing your shared audience, you can identify emerging players before they become serious challenges. It also reveals whether your industry is dominated by a few key players or spread across many competitors.
This data is also useful for media buying and partnerships. Knowing where overlapping audiences go after visiting a competitor’s site allows you to strategically place ads or sponsored content. Similarly, identifying complementary websites that share your audience can lead to co-marketing opportunities that benefit both parties.
"Knowing where users go after visiting a competitor site helps you find potential partnership and advertising opportunities." - Natalia Zhukova, Semrush
Finally, audience overlap analysis helps you benchmark loyalty and retention. By comparing the percentage of exclusive visitors (those who only visit your site) to shared visitors (those who visit multiple competitors), you can assess how well you're holding onto your audience compared to others in the industry. This metric offers valuable insights into your content’s ability to keep visitors engaged and helps guide strategic improvements.
Key Metrics for Measuring Audience Overlap
Understanding key metrics helps you pinpoint your position in the competitive landscape. One essential metric is Shared Audience Percentage, which identifies the portion of your visitors who also frequent competitor sites. This highlights the level of direct competition and signals the need to stand out more effectively in the market.
Unique Audience Size is another critical measure. By subtracting your shared audience from a competitor's total visitors, you can uncover untapped market segments that you may not be reaching yet.
Engagement and Loyalty Metrics - such as Pages per Visit, Average Visit Duration, and Audience Loyalty - offer deeper insights into how invested your visitors are. For example, higher loyalty percentages suggest stronger connections with your brand, reflecting better retention and brand equity.
"If you and one or more competitors have high overlap, it means you're directly competing for the same customers and should focus on competitive differentiation."
- Natalia Zhukova, Semrush
Data Sources and Tools for Audience Analysis
To get reliable audience overlap data, you need the right tools. The Similarweb Audience Overlap Tool is a great option, as it compares audiences across up to five websites at the same time. This can help you uncover new opportunities and pinpoint untapped markets. Another option is the Semrush Traffic & Market Toolkit, which features an Audience Overlap dashboard. This tool uses interactive Venn diagrams to show shared traffic, unique visitors, and even a "Potential Audience" - users visiting competitors but not your site.
Using Competitor Analysis Tool for Audience Insights
The Competitor Analysis Tool (https://competitorscan.io) simplifies audience insights by directly comparing your site with a competitor’s. It highlights areas where your competitors are attracting visitors that you’re missing, identifying visibility and demand gaps. Unlike more complex platforms that require SEO knowledge, this tool provides actionable recommendations through straightforward comparisons and benchmarks. Plus, you can start with a free analysis - no credit card required - making it an easy way to get a quick overview of your competition. For deeper insights, you can expand your research with other third-party platforms.
Third-Party Data Platforms
Additional tools can help round out your audience research. Social media platforms like Facebook Insights and LinkedIn Analytics offer useful demographic and interest data. For quick traffic estimates, the Similarweb Browser Extension provides basic traffic stats and top keywords, while Ubersuggest allows one free search per day for traffic and SEO keyword data. Another option is SpyFu, which lets you view a competitor’s top six organic pages at no cost.
When using third-party platforms, it’s important to pay attention to the type of data being reported. Look for tools that clearly differentiate between total visits and unique visitors to avoid inflating your audience numbers. Also, check whether the data covers desktop traffic only or includes mobile and app traffic - excluding mobile can significantly underestimate your total reach. This level of detail ensures your analysis reflects the full picture, helping you make smarter, data-driven decisions.
Step-by-Step Guide to Assess Competitor Audience Overlap
5-Step Process to Assess Competitor Audience Overlap
Now that you know the tools at your disposal, let’s break down how to use them effectively. This guide outlines five practical steps to analyze audience overlap and extract actionable insights.
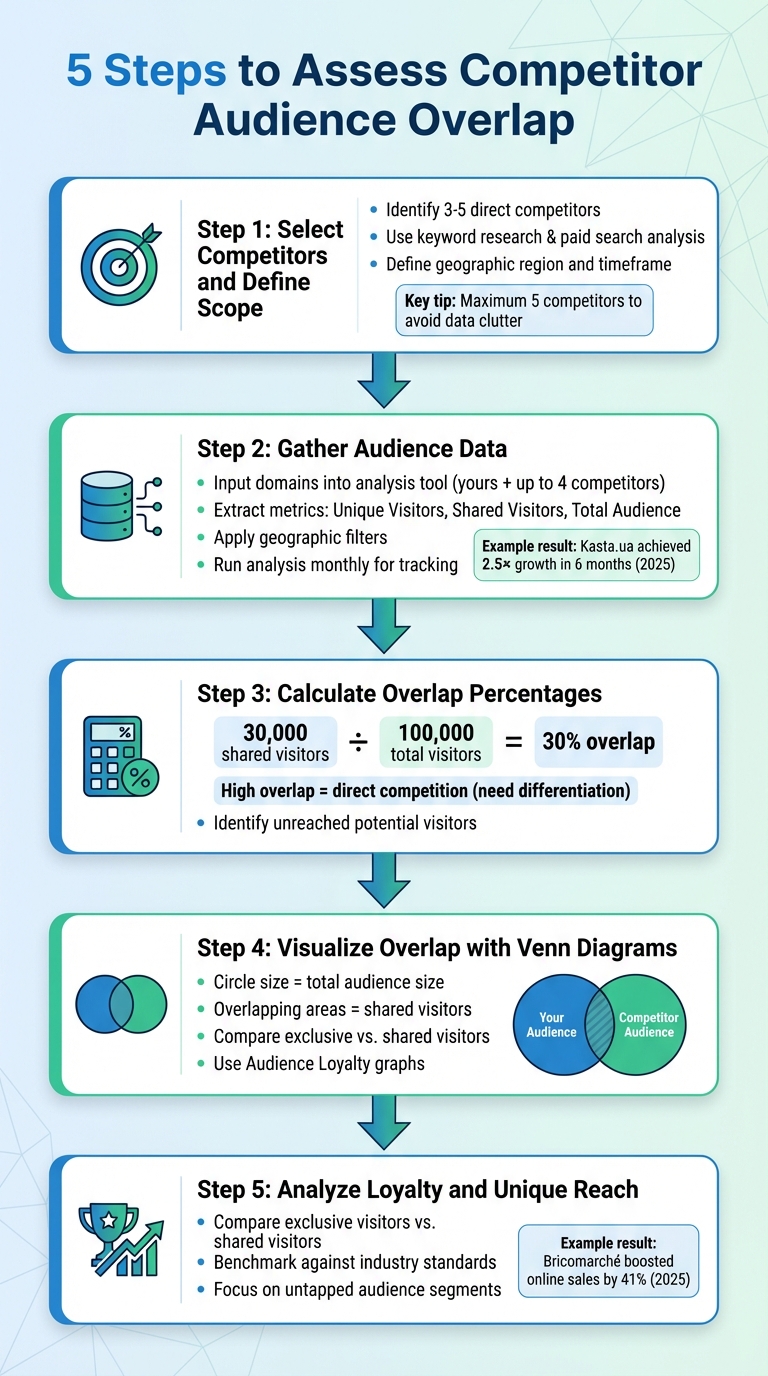
Step 1: Select Competitors and Define Scope
Start by identifying 3–5 direct competitors offering similar products or services. Use keyword research to spot businesses consistently ranking for your main search terms, and check paid search ads to see who’s bidding on the same keywords.
Stick to a maximum of five competitors to keep your data easy to interpret. Too many competitors can overwhelm your analysis with cluttered data. Make sure your selection aligns with your business objectives. For example, if you’re targeting a premium market, focus on competitors in that space rather than casting a wider net.
Define clear boundaries for your analysis. Specify your geographic region (e.g., a specific country or a global market) and timeframe (e.g., the past month or quarter). These filters ensure your data aligns with your target audience. To refine your understanding, consider conducting win-loss research, such as interviewing recent buyers, to learn which competitors they evaluated before choosing.
| Competitor Type | Definition | Example |
|---|---|---|
| Direct | Offers similar products or services | Samsung vs. Apple (Smartphones) |
| Indirect | Targets the same audience with different offerings | Bicycle shop vs. local gym (Fitness) |
| Market Influencer | Influences behavior within your niche | Industry-specific YouTubers or TikTokers |
Step 2: Gather Audience Data
Input your domain and up to four competitor domains into your chosen analysis tool. Extract metrics like Unique Visitors, Shared Visitors, and Total Audience. Platforms like the Competitor Analysis Tool (https://competitorscan.io) simplify this process by directly comparing metrics, helping you spot visibility gaps without needing deep SEO expertise.
Beyond numbers, gather qualitative insights. Use AI scrapers to analyze competitors’ top-performing pages for content, offers, and calls-to-action. This helps explain why overlaps occur. For instance, in 2025, the Ukrainian e-commerce site Kasta.ua used competitive traffic data to achieve 2.5× growth in just six months.
Remember to apply geographic filters, as user behavior often varies by region. Run your analysis monthly to track shifts in audience share and loyalty over time. Once the data is consolidated, calculate overlap percentages to better understand your position.
Step 3: Calculate Overlap Percentages
Take your audience data and calculate overlap rates. For example, if your site gets 100,000 unique monthly visitors and 30,000 of them also visit a competitor’s site, that’s a 30% overlap. High overlap rates indicate direct competition for the same audience, emphasizing the need to differentiate.
Also, identify “unreached potential visitors,” or those who visit competitors but not your site. These users represent untapped opportunities within your total addressable market.
Step 4: Visualize Overlap with Venn Diagrams
Venn diagrams are a great way to visualize audience overlap. The size of each circle represents total audience size, while overlapping areas show shared visitors. Many tools let you hover over intersections to see exact numbers and percentages.
For example, a study of athletic apparel brands revealed significant shared audiences, while non-overlapping areas highlighted untapped users. Pair these visuals with Audience Loyalty graphs to see the ratio of exclusive visitors (those who only visit one site) versus users visiting multiple sites. This adds depth to your understanding of audience behavior.
Step 5: Analyze Loyalty and Unique Reach
Using your calculated metrics, dig deeper into loyalty and unique reach. Determine how many users visit only your site compared to those who also visit competitors. Comparing your loyalty rates to industry benchmarks can reveal areas for improvement in user retention.
Focus on the audience segments visiting competitors but skipping your site. These groups represent valuable growth opportunities. Adjust your targeting strategies accordingly. For example, if you notice high overlap within your ad sets, it could signal redundant delivery or a need for more distinct messaging.
In 2025, Bricomarché, a home improvement retailer, leveraged competitor benchmarking to boost online sales by 41%. By analyzing traffic and engagement metrics, they identified gaps and adjusted their strategy effectively.
Interpreting Results and Deriving Actionable Insights
After gathering and calculating your data, the real challenge lies in transforming those numbers into meaningful strategies. This step is what separates businesses that merely collect data from those that actively grow and thrive because of it. In fact, over 70% of marketers rely on data insights to guide their decisions, with those who do so effectively seeing profit increases averaging 8%.
Identify Opportunities with Overlap Table
With your data in hand, the next move is pinpointing growth opportunities using your overlap table. Start by sorting by "Potential Audience" volume to identify which competitor's audience offers the largest untapped segment. These are users who already show interest in what you provide (by visiting competitors) but haven’t yet found your site. Converting these individuals is often easier than starting from scratch with cold prospects.
A high overlap with competitors indicates a "red ocean" scenario - an intensely competitive market. Here, success often depends on standing out through better user experiences, competitive pricing, or offering something unique. On the other hand, low overlap suggests a "blue ocean" of untapped opportunities. In these cases, focus on understanding how competitors are reaching these audiences and look for ways to break into these spaces.
Overlap data can also reveal valuable collaboration opportunities. Look for non-competing sites that share traffic with your competitors, often listed as "Visited Domains" or "Referral Sites." These could be ideal partners for affiliate marketing, joint campaigns, or sponsored content. Additionally, tracking where users go after leaving a competitor's site can help you identify high-traffic destinations for display ads or content partnerships.
Benchmark Against Industry Averages
Once you've identified opportunities, it's essential to compare your performance against industry standards to refine your strategy. Use tools to switch between "Comparison" and "Industry" views, allowing you to measure your audience loyalty against relevant benchmarks. This step provides critical context - what might seem like strong performance on its own could actually fall short when compared to your industry peers.
Pay close attention to your Audience Loyalty metric, which measures how many users visit only your site versus those who browse multiple competitors. If your loyalty metric is low, it may be time to focus on retention strategies. Conversely, if you're already retaining users well, you might shift your efforts toward expanding your reach. Many tools filter out mega-sites like Google or Facebook to ensure your results aren't skewed by their universal overlap.
To further refine your strategy, categorize yourself and your competitors into a growth quadrant:
- Leaders: Large audience, high growth.
- Game Changers: High growth potential.
- Established Players: Large audience, stable growth.
- Niche Players: Smaller audience, often focused on specific segments.
This framework provides a clear picture of your market position and helps you set realistic goals. For example, if you're a Niche Player competing against Leaders, your approach will naturally differ from that of an Established Player working to maintain market share.
Conclusion
Analyzing competitor audience overlap goes beyond just crunching numbers - it’s about turning those insights into actionable growth strategies. By identifying shared users between your site and your competitors', you can estimate your total addressable market, uncover untapped opportunities, and fine-tune your marketing spend by avoiding redundant targeting efforts.
The process doesn’t have to be overwhelming or time-consuming. With tools like the Competitor Analysis Tool, you can gain actionable insights in less than two minutes. Forget messy spreadsheets and guesswork - this tool offers clear recommendations to help you spot growth opportunities and identify potential threats.
Overlap data can guide your strategy in multiple ways. If competition is high, use it to sharpen your unique selling proposition. If overlap is low, study competitor positioning to tap into new audience segments. Tracking these metrics monthly helps you stay ahead, spot emerging challenges, and adapt your approach as needed. From optimizing ad exclusions to avoid wasting budget to identifying potential partnerships with complementary sites, audience overlap analysis gives you a clear path to drive growth.
FAQs
What’s a “good” audience overlap percentage?
When evaluating audience overlap, a percentage between 20% and 30% is often seen as a reasonable range. This level suggests some shared audience while avoiding excessive redundancy. Percentages that go much higher could signal a significant overlap, which might restrict your ability to expand your reach. Always consider your specific goals when analyzing overlap and fine-tune your strategies as needed.
How do I estimate my total addressable market from overlap data?
To calculate your total addressable market (TAM) with overlap data, start by examining the audience overlap between your target market and your competitors. Tools designed for audience analysis can help you measure this overlap accurately. Once you have this data, scale it proportionally to estimate the size of the entire market.
For a more precise calculation, combine this overlap data with insights from market research and industry reports. This approach provides a clearer picture of the potential revenue opportunities within your market.
How can I turn overlap insights into better ads and partnerships?
Dive into shared audience segments to discover overlapping interests, behaviors, and demographics. This analysis can reveal what truly connects your audience, giving you the insights needed to create messaging and strategies that feel personal and relevant. When your content resonates on this level, you're more likely to see higher engagement and conversions.
But that's not all. Shared audience data can also open doors to strategic partnerships. Look for competitors or complementary brands that attract similar audiences. By collaborating, you can not only expand your reach but also strengthen your position in the market. These partnerships allow both parties to tap into shared interests, creating opportunities for mutual growth.
To get the best results, focus your efforts on high-value audience segments. These are the groups most likely to respond positively to your campaigns and partnerships, ensuring your time and resources are well spent.