
Why User Behavior Data Matters in SaaS Experiments
Behavioral data, not guesswork, reveals the in-app actions that predict retention, activation, and revenue.

User behavior data is the secret weapon for SaaS growth. It reveals how customers interact with your product, helping you improve retention, activation, and revenue. Instead of guessing, you can pinpoint what drives engagement and fix what doesn’t. Here’s why it’s powerful:
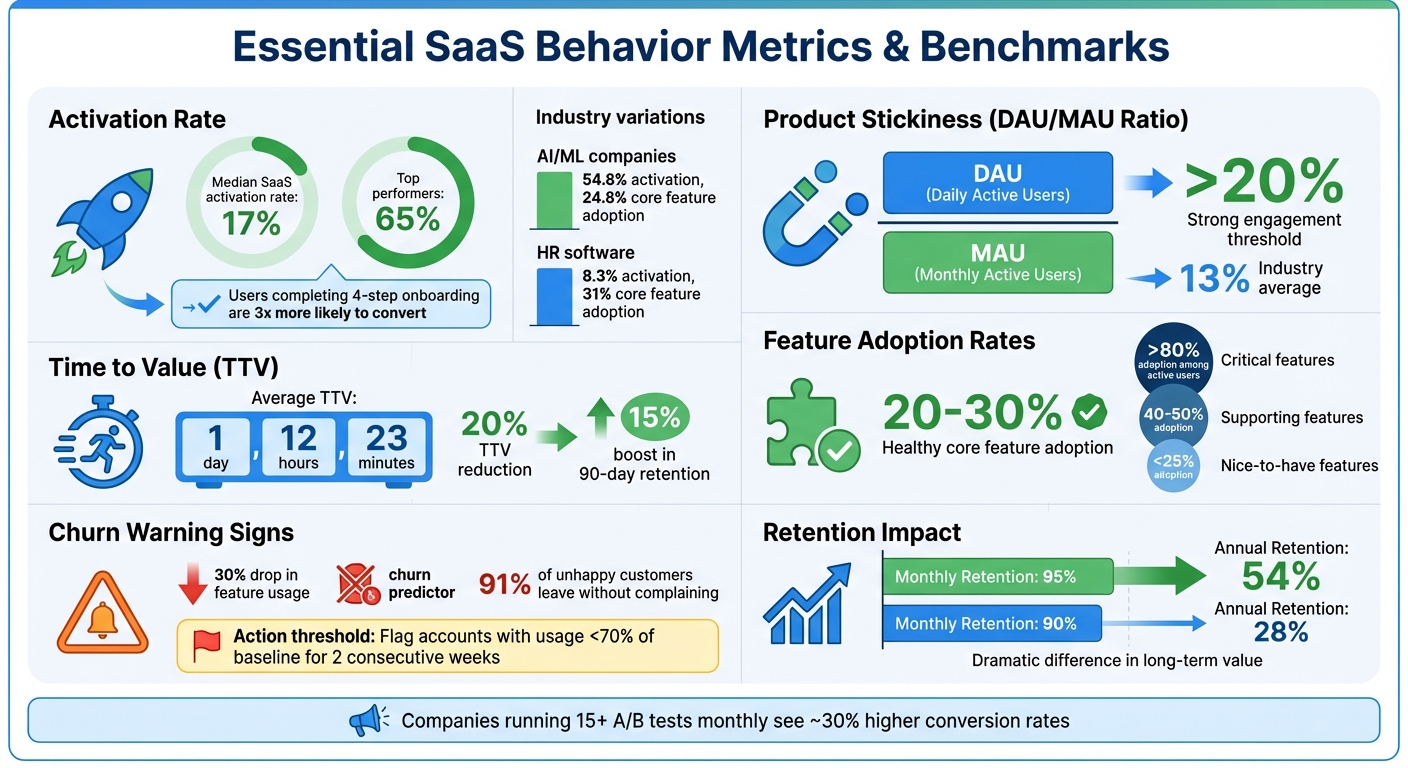
- Retention Impact: A 95% monthly retention rate equals 54% annual retention, while 90% drops to 28%.
- Key Metrics: Metrics like activation rate, product stickiness (DAU/MAU ratio), and Time to Value (TTV) directly influence success.
- Behavioral Insights: Actions like uploading files or inviting teammates can predict long-term loyalty.
- Churn Prevention: Early warning signs like a 30% drop in feature usage help you act before users leave.
- Experimentation: Behavioral data sharpens A/B testing and cohort analysis, leading to better product decisions.
The companies that track and act on this data achieve higher retention, better feature adoption, and faster growth. Keep reading for actionable strategies to leverage user behavior data in your SaaS experiments.
How To Track User Behavior in SaaS – 6 Key Strategies
Key Metrics for Tracking User Behavior
Key SaaS User Behavior Metrics and Benchmarks
Tracking the right metrics is essential for driving growth in SaaS. Here's why: the median activation rate for SaaS companies is just 17%, but top performers manage to hit 65%. This stark contrast comes down to one thing - knowing which user behaviors predict long-term success.
Activation rate, which measures the percentage of users who reach your product's "Aha moment", is one of the strongest indicators of retention. To pinpoint this moment, analyze the first-week actions of users who stay active beyond 90 days. For instance, Sked Social found that users who completed a four-step onboarding process were three times more likely to convert into paying customers.
Another critical metric is product stickiness, calculated as the ratio of Daily Active Users (DAU) to Monthly Active Users (MAU). A ratio above 20% suggests strong engagement, while the industry average hovers around 13%. This metric reveals whether users are making your product part of their routine or just visiting sporadically.
Then there’s Time to Value (TTV) - how quickly users achieve a meaningful milestone. The average TTV for SaaS products is 1 day, 12 hours, and 23 minutes. Reducing this time by 20% has been linked to a 15% boost in 90-day retention. Speeding up the process of delivering value can make a big difference in keeping users around.
Beyond these, it’s also important to dive into usage frequency and depth for a fuller picture of engagement.
Frequency and Depth of Usage
Frequency tells you how often users return, while depth shows how much of your product they explore. Both are valuable but paint different pictures. Take Under Armour Connected Fitness as an example. They noticed low engagement with their race training plans. By expanding the plans to include a variety of goals, they tripled usage among paid users and saw a significant boost in conversions and retention.
Frequency reflects how regularly users engage, while depth reveals how thoroughly they interact with features. For example, a user logging in daily but only using one basic feature may indicate high frequency but low depth - an issue worth addressing. On the other hand, a weekly user engaging with multiple advanced features demonstrates strong depth despite lower frequency. Research shows a 30% drop in feature usage frequency can often predict churn.
"Metrics can act as an early warning system... They may highlight a part of your product that doesn't work for your customers. It can be easy to take momentary success for granted, but markets change, and so do the needs of your users." - Michael Pierce, Director of Product Management, Public Consulting Group
Setting thresholds for usage patterns can help you act before it’s too late. For example, flag accounts for intervention if their usage drops below 70% of their baseline for two consecutive weeks. Since 91% of unhappy customers leave without complaining, these behavioral shifts could be your only chance to step in.
Feature Adoption Rates
Tracking feature-specific adoption rates helps refine your product roadmap. Feature adoption has two key aspects: breadth (how many users try a feature) and depth (how often they use it). Healthy SaaS products aim for core feature adoption rates of 20–30%. This information can guide you in prioritizing features that users find valuable.
A great example is The Room, which increased CV uploads by 75% - from 205 to 325 per week - within 10 days by adding a simple UI prompt for the "upload CV" button. Small tweaks like these can lead to a 20–40% boost in feature adoption.
Adoption rates also vary by industry. For example, AI and ML companies average 54.8% activation rates with 24.8% core feature adoption, while HR software averages 8.3% activation with 31% core feature adoption. Learning how to analyze competitor website data and benchmarking against your industry helps set realistic goals.
Categorize features by their impact on retention. Critical features essential for daily use should maintain adoption above 80% among active users. Supporting features that enhance workflows typically see 40–50% adoption, while less critical features often fall below 25%. This framework helps you decide where to focus development efforts.
Session Duration and Patterns
Session duration offers insight into how users interact with your product. Longer sessions often indicate users are finding value and making progress, while short sessions might signal usability issues. However, the ideal session length depends on your product type - task management tools may average 20 minutes, while design platforms could see sessions lasting hours.
Attention Insight improved its activation rate by 10% and increased in-app time by 24% in 2025 after introducing interactive walkthroughs. The longer sessions showed users were exploring features rather than getting stuck. Tracking session duration alongside task completion rates can help differentiate productive engagement from frustration.
IBM provides another example. By analyzing session patterns to identify friction points, they revamped their onboarding process and in-app support. This led to a jump in retention from 50% to over 70% and tripled week-over-week returns. Instead of treating session data as vanity metrics, they used it to drive meaningful improvements.
"A retained dollar is worth a lot more than a newly acquired dollar that has yet to renew." - Daria Danilina, Co-founder, Salesroom
Accurate session tracking can turn raw data into actionable insights, making it a powerful tool for growth.
Using Behavior Data to Run Experiments
Behavioral data has become a game-changer for running experiments in SaaS. Instead of relying on random tweaks, companies now analyze user behavior to design experiments that directly address pain points. This approach isn't just theory - it works. Companies running 15 or more A/B tests monthly have seen conversion rates jump by about 30% compared to those testing less frequently.
The secret? Moving past surface-level metrics. Aggregate data, like an overall retention rate of 40%, can hide the real story. Segmenting users based on specific actions - like completing a core feature - reveals the behaviors that truly impact retention.
Cohort Analysis for Retention Insights
Cohort analysis takes a closer look at groups of users who share a common starting point, such as signing up or completing onboarding. By tracking their engagement over time, this method uncovers patterns that generalized data often misses. For example, research shows that users who complete a core "sticky" action within their first week retain at nearly three times the rate of those who don’t.
A key concept here is the "retention plateau" - the point where the retention curve levels off. This plateau is often a sign that your product has achieved product-market fit. In contrast, a continually declining curve suggests that the product hasn’t yet become a habit for users.
"A flattening retention curve is the strongest signal of product-market fit." - KISSmetrics Editorial
By analyzing retention rates across different cohorts and time periods, teams can measure the impact of their experiments. Segmenting users further - based on actions like syncing their CRM - helps identify the "Aha moment" that predicts long-term engagement. These insights can guide adjustments to onboarding and inform which features should take priority.
Behavioral Segmentation to Prioritize Features
Breaking users into groups based on their in-app behavior reveals which features matter most. Take Beable, for example. In March 2026, the company used Jobs-to-be-Done (JTBD) segmentation to tailor tutorials for different user groups. This strategy boosted survey participation by 77%. Similarly, Userpilot’s UX researcher, Lisa, focused on power users of the "segmentation" feature for usability testing. Her targeted approach recruited 19 participants in just a few days - a response rate four times higher than generic outreach.
Segmentation also keeps resources from being wasted. For instance, offering discounts only to users who need extra encouragement avoids losing revenue from those who would convert without incentives. Combining behavioral insights with business goals - like identifying features popular among high-value customers - helps teams focus development efforts where they’ll have the most impact.
A/B Testing to Validate Behavioral Changes
Behavioral data makes A/B testing sharper by allowing teams to divide their audience into meaningful segments. For example, a UI update might improve activation rates for tech-savvy users but confuse less technical ones. These differences only come to light with segmented analysis. In March 2026, Kontentino swapped its generic product tour for interactive walkthroughs tailored to user goals. The result? A 10% boost in user activation .
Before launching tests, define guardrail metrics. Optimizing for one metric, like sign-ups, can backfire if it harms long-term outcomes. Measuring both primary results (e.g., activation rates) and secondary effects (e.g., 30-day retention) ensures short-term gains don’t hurt overall growth.
"The companies that win are the ones that can learn the fastest." - Brian Balfour, former VP of Growth at HubSpot
The rewards for rigorous testing speak for themselves. Booking.com credits over $100M in annual revenue to insights from its testing program. Likewise, Microsoft reported a 10–25% improvement in key metrics after adopting strict A/B testing protocols. By using behavioral data to craft smarter experiments and analyze the results thoroughly, SaaS companies can unlock meaningful growth opportunities.
Combining Behavioral Data with User Feedback
Behavioral data reveals what users do, while user feedback explains why they do it. On their own, each offers only part of the story. But together, they provide a fuller picture that leads to smarter, more effective product decisions.
Here’s the catch: users aren’t always the most reliable narrators of their own actions. They might express enthusiasm for a feature but never actually use it once it’s implemented. This disconnect - known as the "action versus claim gap" - often stems from optimism bias or a lack of self-awareness. Behavioral data serves as a reality check, showing what users actually do, not just what they say they’ll do. By combining these two perspectives, you not only identify problems flagged by raw data but also uncover the reasons behind them.
Identifying Pain Points Through Feedback
Behavioral analytics can pinpoint exactly where users are running into trouble. For instance, a sudden drop-off at a specific step in a funnel or a decline in feature usage signals that something’s wrong. However, data alone doesn’t explain why the problem exists. That’s where qualitative feedback steps in to provide clarity.
Take this example: in 2024, a financial institution noticed a significant drop in account logins through Amplitude analytics. While they could see the "what", the "why" remained unclear. By reviewing session replays, they discovered that mobile users were experiencing two-factor authentication (2FA) failures. This insight allowed the team to resolve the technical glitch and notify only the affected mobile users - avoiding unnecessary assumptions or broad interventions.
Opendoor’s growth team, led by Nikunj Kothari, has mastered this process. They use Amplitude for tracking user behavior and Sprig for gathering qualitative feedback through microsurveys. When Amplitude highlights a drop-off, they deploy targeted microsurveys to ask the affected users directly why they’re leaving. This method eliminates the need for lengthy A/B testing by quickly identifying the root cause.
"Amplitude shows us when and where we have issues, and Sprig helps us quickly find out why. Without the qualitative insights... we would need to spend weeks deploying many A/B tests." - Nikunj Kothari, Growth Product Lead, Opendoor
This combination of tools makes it easier to understand user pain points and address them with precision.
Improving Retention with User-Centric Adjustments
When you understand both what users are doing and why they’re doing it, you can make changes that genuinely improve their experience - not just the metrics. For example, in 2022, Under Armour Connected Fitness noticed through behavioral analytics that engagement with their race training plans was low. Instead of guessing the cause, they analyzed user data to uncover what their audience actually wanted. They revamped the plans to include a broader range of options, from beginner-friendly training to advanced cardio programs. The result? Usage of the feature tripled among paid users, and overall retention saw a noticeable boost.
Similarly, Super.com achieved a 90% increase in retention by combining behavioral insights with user feedback. They identified what made their users feel rewarded and used that information to address emotional motivators behind engagement.
"It's really important to have both quantitative and qualitative metrics at every part of the funnel and look at them simultaneously to make sure you're not just improving business metrics, but you're improving customer satisfaction." - Nikunj Kothari, Growth Product Lead, Opendoor
This dual approach also helps prioritize which users need attention. For instance, if behavioral data shows that a group hasn’t interacted with a key feature by day five, you can send a microsurvey asking if they’re aware of the feature or if its placement is unclear. These timely interventions can turn potential churn into renewed engagement, keeping users on board and satisfied.
Using Predictive Models for Growth
Behavioral data doesn’t just document what’s already happened - it can also give you a glimpse into the future. By applying machine learning, teams can predict churn and retention trends, transforming their approach from reactive problem-solving to proactive planning. Predictive models help you anticipate challenges before they arise, giving you the chance to act early.
For example, combining behavioral signals with business-specific data can refine your risk assessments. Imagine layering CRM data - like deal size, renewal dates, or account age - onto login frequency metrics. An enterprise account worth $80,000 showing a drop in feature usage would demand immediate attention, while the same trend from a $50/month user might call for a different approach altogether.
Churn Prediction from Behavioral Patterns
Churn prediction models are designed to catch early warning signs, such as steady decreases in usage, stalled engagement, or abandonment of key features. For instance, a user logging in less than once a week or skipping a critical onboarding step could be flagged as high-risk, even before churn appears in standard reports.
Churn rates can be a major challenge for SaaS companies. Mid-market SaaS businesses often experience 5–8% annual churn, while early-stage startups may face 10–15%. A seemingly small monthly churn rate of 5% can snowball into an annual loss of nearly 46%. Predictive models that track indicators like login frequency, session length, and feature adoption have been shown to achieve up to 95% accuracy in identifying at-risk users. Additionally, a drop of 10 points in a company’s Net Promoter Score has been linked to a 10% increase in churn.
"Businesses I've worked with find that focusing on churn means teams are already late to the game. Measuring customers' ability to reach their value objectives leads to more expansion, and customers who expand are less likely to churn." - Doug Norton, Senior Director of Customer Success, BILL
The choice of predictive algorithm depends on your dataset and goals. Logistic regression works well for smaller datasets when you need clear, probability-based insights. For larger datasets, decision trees or random forests can help identify the top factors contributing to churn. If you’re working with complex patterns, gradient boosting or neural networks offer the precision needed to uncover subtle interactions. These tools reinforce the importance of using behavioral data to make informed, forward-thinking decisions.
Forecasting Retention Improvement Opportunities
Predictive models don’t just highlight risks - they also uncover opportunities. By identifying the behaviors that lead to long-term success, you can replicate those patterns across your user base. For instance, if your data shows that users who adopt a key automation feature within their first 30 days are more likely to stick around, you can design campaigns to encourage others to reach that milestone.
While traditional approaches like segmentation and A/B testing remain useful, predictive models take things a step further by identifying "success behaviors" in real time. AI tools can now monitor user cohorts and alert teams when retention metrics deviate from historical trends over a 14-day period. This allows Customer Success teams to act quickly, responding to live behavioral data instead of waiting for periodic reviews.
"The traditional analytics workflow goes: human notices (if they're looking), human investigates (if they have time), human acts (if they remember). Agents flip that on its head." - Ibby Syed, Founder, Cotera
To make these predictions useful, it’s important to define churn in a way that fits your product - whether that’s 30 days of inactivity or outright subscription cancellation. Then, create playbooks for specific scenarios. For example, if a high-value account’s health score drops, you could automatically schedule personalized training sessions. Finally, since customer behavior and market conditions change, remember to retrain your models every three to six months to keep them accurate.
Using Competitor Analysis for SaaS Growth
User behavior data gives you an inside look at how people interact with your product, but competitor analysis helps you understand the bigger picture in your market. By combining these two perspectives, you can spot opportunities in messaging, demand, and visibility that might otherwise slip through the cracks.
Take keyword gap analysis, for instance. This can show you the search terms your competitors rank for that your site doesn't. When paired with internal data - like which search terms lead to user activation or retention - you can prioritize creating content that drives high-quality traffic.
Another useful tactic is examining the landing pages competitors promote through their PPC campaigns. These pages often represent their best-performing assets. As Brett Farmiloe, CEO of Terkel, advises:
"Follow the money trail. Visit the landing pages your competitors pay to promote. If they are spending money to drive traffic to a landing page, it is likely converting."
To dig even deeper, tools like Competitor Analysis Tool (https://competitorscan.io) can help you compare your site with competitors. These tools highlight gaps in demand, messaging, and visibility, enabling you to make informed decisions - even without extensive SEO expertise. Knowing where your competitors excel and where they fall short gives you a clear direction for refining your growth experiments.
However, it’s important to avoid simply copying what your competitors are doing. Just because they’re investing heavily in a particular feature or channel doesn’t mean it will resonate with your audience. Instead, validate these insights with your own user data. For example, if competitor analysis points to a growing interest in a feature category, check whether your most loyal users have been requesting something similar through feedback or support tickets. This way, you’re building a strategy rooted in both market trends and user needs.
Competitor onboarding analysis is another valuable angle. By creating test accounts on competitor platforms, you can identify trust-building strategies and onboarding flows that work - or don’t. Compare these findings with your own session replays to pinpoint friction points. If you notice a common issue, like a confusing signup process, you can run A/B tests to simplify that step. This approach blends competitive intelligence with real user behavior to improve activation rates.
Conclusion
User behavior data forms the backbone of effective experimentation in SaaS. The most successful teams focus on tracking individual user journeys throughout the customer lifecycle, rather than relying on anonymous pageviews. They zero in on 5–10 key events - like activation milestones or feature usage - and design experiments based on actual user actions rather than assumptions about demographics.
Even a seemingly small 5% improvement in monthly retention can lead to a noticeable impact on annual results. Yet, less than 30% of SaaS companies currently track activation or retention metrics at the product level in a structured way. This oversight presents a huge opportunity for teams that invest in properly instrumenting their products.
A good starting point? Hold weekly 30-minute metrics reviews to guide focused product and marketing initiatives. To prioritize experiments, apply the ICE framework - Impact, Confidence, and Ease - to determine where to start. For B2B products, consider a different approach: run small-scale pilots with 3–5 engaged users to collect meaningful qualitative feedback before scaling up.
Additionally, combine your internal user data with market insights to refine your strategy. Tools like Competitor Analysis Tool (https://competitorscan.io) can reveal gaps in demand and messaging, but always validate these findings against your own user data. As the Statsig Team wisely points out:
"Every failed test teaches you something about your customers".
The true value of analytics emerges when you go beyond generating reports and start using data to answer targeted business questions. Where are users struggling during onboarding? What actions signal potential upsells? What patterns indicate churn is likely? By focusing your analytics on actionable user behaviors, you can transform overwhelming data into clear insights that drive growth.
FAQs
What events should I track first in my SaaS?
Start by keeping an eye on key user actions such as how often specific features are used, the steps users take during onboarding, and the triggers that drive engagement. These details give you a clearer picture of user behavior, making it easier to refine strategies for better activation and retention.
How do I find my product’s “Aha moment”?
To uncover your product's “Aha moment,” start by digging into user behavior. This is the point where users truly understand the value your product brings. Pay attention to specific actions or milestones during onboarding that lead to increased activity, better retention, or even referrals. Tools like session replays, user interviews, and behavior tracking can help you zero in on this moment. Once you've nailed it down, refine your onboarding process to steer users toward it as quickly as possible.
How can I predict churn using behavior data?
Predicting churn means examining user behavior to spot signs of disengagement. These signs might include less frequent logins, shorter session durations, reduced activity, or users abandoning specific features. By monitoring these patterns, businesses can create models that categorize users based on their likelihood to churn.
Another useful tool is cohort analysis, which helps uncover trends that lead to churn. With these insights, companies can take proactive steps, like sending personalized messages or offering tailored support, to re-engage users and boost retention rates.