
Mobile vs Desktop PageSpeed: Why It Matters for SaaS
How mobile load times hurt SaaS conversions and SEO, plus practical fixes to speed pages and boost signups.

Page speed directly affects your SaaS business's bottom line. Here's why: mobile users make up over 65% of web traffic but convert at half the rate of desktop users. Slow load times on mobile devices lead to higher bounce rates, lower engagement, and fewer signups. Google’s mobile-first indexing means poor mobile performance can also hurt your search rankings, even if your desktop site is fast.
Key Points:
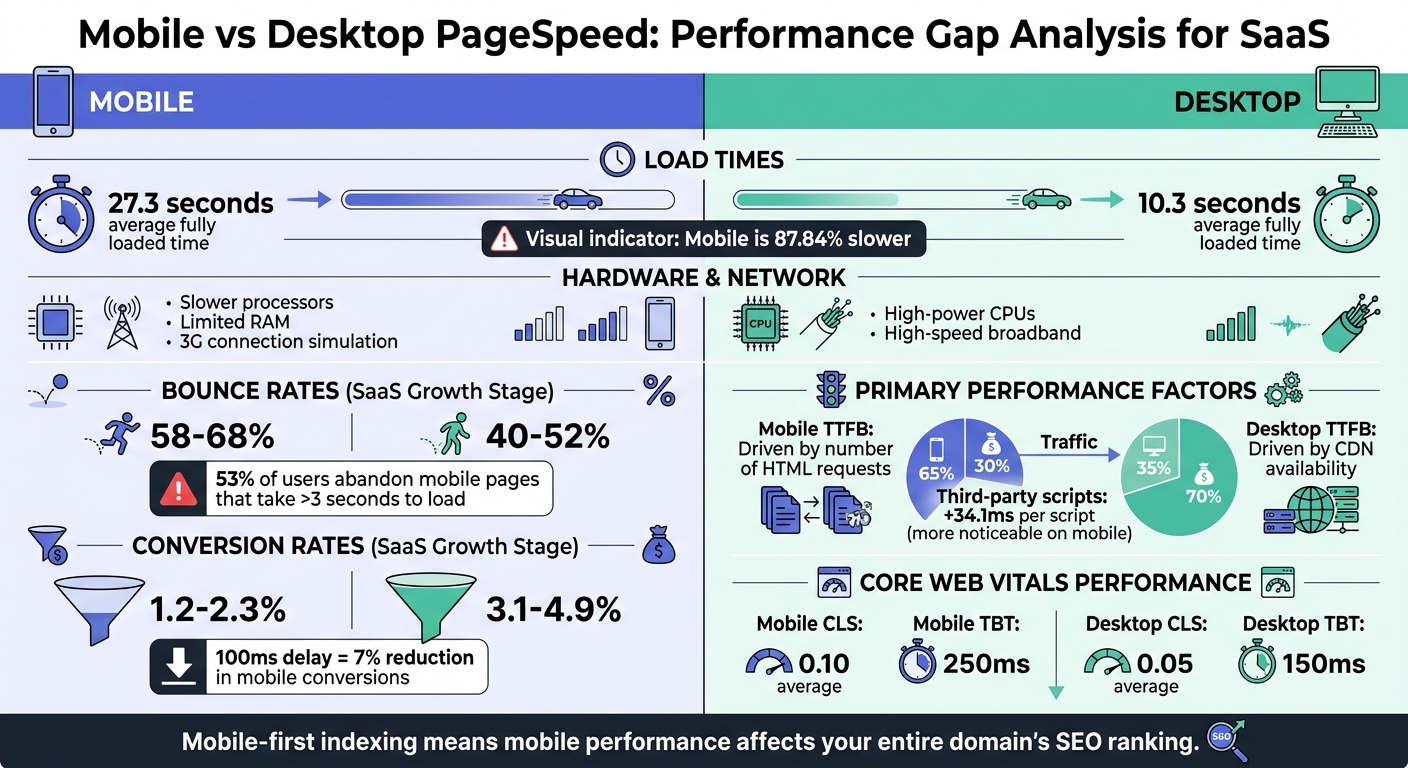
- Mobile vs Desktop Conversion Rates: Mobile: 1.2–2.3%, Desktop: 3.1–4.9%.
- Load Times: Mobile pages average 27.3 seconds to load, compared to 10.3 seconds on desktops.
- Impact on SEO: Google prioritizes mobile performance for rankings. You can analyze competitor website performance to see how your speed stacks up against the market.
- User Behavior: Over 50% of users abandon mobile pages that take more than 3 seconds to load.
Quick Fixes:
- Compress images (WebP/AVIF) and enable lazy loading.
- Use CDNs to reduce load times.
- Defer non-essential scripts and optimize JavaScript execution.
Improving mobile page speed isn’t just a technical tweak - it’s a way to boost conversions and revenue. Even a 100ms delay can reduce mobile conversions by 7%. Start optimizing today to close the performance gap.
Why Mobile Page Speed Will MAKE or BREAK Your WEBSITE in 2025
sbb-itb-0a8c96a
Key Differences Between Mobile and Desktop PageSpeed
Mobile vs Desktop PageSpeed Performance Comparison for SaaS
Technical Factors That Affect Performance
Mobile devices often lag behind desktops in performance due to their slower processors and limited RAM. Desktops, equipped with more powerful CPUs, handle JavaScript and complex rendering tasks with greater ease.
Network conditions widen this gap even further. Mobile tests simulate a 3G connection, while desktop tests assume high-speed broadband. This difference results in mobile pages loading about 87.84% slower - taking an average of 27.3 seconds compared to just 10.3 seconds on desktops.
The factors influencing performance also vary between the two platforms. On mobile, Time to First Byte (TTFB) is largely impacted by the number of HTML requests, whereas on desktops, TTFB depends more on the efficiency of Content Delivery Networks (CDNs). Additionally, mobile devices require extra CSS rules for viewport sizing and image adjustments, adding a layer of complexity absent in desktop rendering. Every third-party script increases load time by approximately 34.1 milliseconds, a delay that is far more noticeable on mobile devices.
"80-90% of the end-user response time is spent on the front end. Start there." – Steve Souders, former Google Performance Engineer
These technical differences play a significant role in shaping user experiences across devices.
User Behavior and Engagement Metrics
The technical challenges on mobile devices directly influence user behavior. Mobile users tend to be less patient, with bounce rates significantly higher than those on desktops. For SaaS companies, mobile bounce rates fall between 58% and 68%, compared to 40% to 52% for desktop users. If a mobile page takes more than 3 seconds to load, over half of users abandon it. In fact, as load times increase from 1 second to 10 seconds, the likelihood of a mobile user bouncing skyrockets by 123%.
Conversion rates also reflect this disparity. Growth-stage SaaS businesses report mobile conversion rates of just 1.2% to 2.3%, while desktop conversions range from 3.1% to 4.9%. This gap stems from more than just slower load times; mobile users are often multitasking or dealing with unstable connections, unlike desktop users who usually browse in more stable and focused settings.
Comparison Table: Mobile vs Desktop PageSpeed
| Factor | Desktop Performance | Mobile Performance |
|---|---|---|
| Processor Speed | High-power CPUs; efficient JS execution | Slower processors; higher script latency |
| Network Condition | High-speed/Wired (Stable) | Simulated 3G/Cellular (Variable/Throttled) |
| Primary TTFB Driver | CDN Availability | Number of HTML Requests |
| Avg. Fully Loaded Time | 10.3 seconds | 27.3 seconds |
| Bounce Rate (SaaS Growth) | 40-52% | 58-68% |
| Conversion Rate (SaaS Growth) | 3.1-4.9% | 1.2-2.3% |
How PageSpeed Affects SaaS Performance
Mobile PageSpeed and Its Effects on SaaS Metrics
Slow mobile load times are a massive roadblock in the SaaS customer journey. Studies show that if a mobile page takes more than 3 seconds to load, 53% of visitors abandon the site, slashing your potential customer base in half.
The impact on conversions is hard to ignore. A 100-millisecond delay in mobile load time can shrink conversion rates by up to 7%. For early-stage SaaS companies, where mobile conversion rates already hover between 0.8% and 1.5% - compared to 2.2% to 3.8% on desktop - this delay can be devastating.
Session durations also take a hit. Visitors spend 40% less time on slow mobile pages compared to desktop, engaging with fewer pages and often skipping key actions like signing up for a trial.
Then there’s the revenue gap. While mobile traffic often makes up over 60% of total visits, it typically accounts for just 30% of revenue. SaaS businesses often see an even sharper divide, with mobile generating only a small fraction of signups compared to desktop. Pinterest tackled this issue by reducing perceived wait times by 40%, leading to a 15% boost in new user signups.
And it’s not just user behavior that suffers - these performance issues can also drag down your site’s search engine rankings.
SEO Effects of PageSpeed Gaps
Mobile performance doesn’t just affect users; it has a direct impact on your search rankings, thanks to Google’s mobile-first indexing. As Performance & Optimization Specialist Thomas Campbell explains: "Your desktop site could load in 0.5 seconds, but if your mobile version crawls at 8 seconds, Google treats your entire domain as slow".
Google’s Core Web Vitals - metrics like Largest Contentful Paint (LCP), First Input Delay (FID), and Cumulative Layout Shift (CLS) - are primarily measured on mobile devices. Poor scores in these areas can push your site down in search results, cutting into your organic traffic and increasing your customer acquisition costs.
The consequences are steep. A two-second delay on mobile can lead to up to 40% fewer conversions. Considering that over 65% of all web traffic now comes from mobile devices, ignoring mobile performance doesn’t just hurt rankings - it alienates the majority of your audience and leaves money on the table.
How to Optimize PageSpeed for SaaS
Addressing the gap between mobile and desktop performance is critical for improving user engagement and conversions in SaaS. Let’s dive into some key strategies.
Optimizing for Mobile Performance
Start with images. Using modern formats like WebP or AVIF and implementing lazy loading can drastically cut load times. For hero images, setting fetchpriority="high" ensures they load first, improving Largest Contentful Paint (LCP).
JavaScript often slows down mobile experiences because these devices typically have less processing power. On mobile, Total Blocking Time (TBT) can hit 250 ms compared to 150 ms on desktops. To address this, defer non-critical scripts with async or defer attributes, which speeds up rendering.
"Mobile page speed is more critical for several reasons. First, it's generally harder to score well for mobile due to the slower internet and less powerful devices. Second, over 50% of web traffic comes from mobile devices."
- Russ Jeffery, Director of Platform Strategy, Duda
Another common issue is layout shifts. Define explicit width and height attributes for images and videos to reduce Cumulative Layout Shift (CLS). On mobile, CLS averages around 0.10, compared to 0.05 on desktop. Finally, compress text-based files like HTML, CSS, and JavaScript using Gzip or Brotli to speed up browser processing.
These mobile strategies lay the groundwork for desktop-specific optimizations, which focus on resource-heavy workflows.
Desktop-Specific Optimization Techniques
While mobile optimization tackles device limitations, desktop strategies revolve around managing resources and enhancing workflows.
Server-Side Rendering (SSR) is a must for faster delivery of fully rendered content, reducing Time to Interactive (TTI) on desktops. Pair this with code minification to shrink CSS, HTML, and JavaScript files, which accelerates parsing and loading.
A Content Delivery Network (CDN) is another game-changer. By serving static assets from servers closer to users, CDNs can reduce Time to First Byte (TTFB) by up to 35%. Hosting static content on a single domain further boosts performance.
"Quick speed hacks will not build the foundation for long-term performance - only real speed improvements will, and that starts with optimizing your underlying theme architecture."
- Nirav Sheth, CEO and Founder, Anatta
For SaaS platforms, optimized hosting infrastructure is crucial to handle traffic spikes smoothly. Combining SSR with a CDN ensures faster interactions, even for resource-heavy applications.
Table: Optimization Strategies and Expected Results
| Optimization Strategy | Focus Area | Expected Outcome |
|---|---|---|
| Lazy Loading | Off-screen images/videos | Reduced initial page weight and faster LCP |
| Image Compression (WebP/AVIF) | Media assets | Lower bandwidth usage and faster mobile load times |
| Minification | CSS, HTML, JS | Reduced file sizes and faster browser processing |
| CDN Implementation | Static assets | Lower TTFB by serving content closer to users |
| Deferring Scripts | Non-critical JS | Improved interactivity and lower INP/TBT |
| Server-Side Rendering | Desktop/SaaS | Faster initial content display for complex apps |
Using Competitor Analysis Tool for Benchmarking

Benchmarking your PageSpeed against competitors is key to identifying areas for improvement. The Competitor Analysis Tool (https://competitorscan.io) makes this process simple. It compares your site's mobile and desktop performance against competitors, highlighting gaps in visibility and user experience.
The tool evaluates both Lab data (from tools like Lighthouse) and Field data (real-world metrics from the Chrome User Experience Report). It focuses on Core Web Vitals - LCP, CLS, and Interaction to Next Paint (INP) - which are critical for Google rankings. You can also set performance budgets, such as limiting mobile page weight to 500 KB, and segment analytics by device type to spot friction points in conversion funnels.
With results available in under two minutes and no SEO expertise required, this tool provides actionable recommendations to help you prioritize optimizations, whether it’s scripts, images, or other features.
Conclusion
The gap between mobile and desktop PageSpeed is more than a technical issue - it’s a direct revenue factor for SaaS companies. With mobile devices making up 62% of web traffic but producing conversion rates less than half of desktop (1.2–2.3% compared to 3.1–4.9%), the stakes are high.
"Page speed has crossed the threshold from a technical optimization to a direct revenue variable."
- Digital Applied
Google’s mobile-first indexing further highlights the importance of mobile performance for SEO success. Yet, only 42% of mobile sites meet all three Core Web Vitals, compared to 63% of desktop sites. This disparity offers a chance to gain a competitive edge. Remember, even a 100ms delay can reduce conversions by 1%, while pages loading in 1 second convert three times better than those taking 5 seconds.
Throughout this article, we’ve explored how this performance gap affects SaaS businesses. The numbers make it clear: improving PageSpeed is essential for driving growth.
Key Takeaways
- Focus on Mobile Optimization: Pay attention to metrics like Largest Contentful Paint (LCP) and Interaction to Next Paint (INP). Techniques like image compression, lazy loading, and JavaScript optimization can deliver quick wins.
- Strengthen Desktop Performance: Use content delivery networks (CDNs) to handle resource-heavy tasks and ensure smooth performance.
- Monitor and Benchmark: Tools like the Competitor Analysis Tool (https://competitorscan.io) can help you track your metrics, compare them to competitors, and pinpoint areas for improvement - no SEO expertise required.
With optimization projects typically costing $8,000–$12,000 but delivering annual revenue increases of $40,000–$120,000, the financial upside is clear. Start optimizing today to close the gap and drive revenue growth.
FAQs
Which PageSpeed metrics matter most for SaaS signups on mobile?
When it comes to SaaS signups on mobile, load time stands out as a critical factor. A faster load time directly improves user experience, which can have a big impact on conversion rates. Slow-loading pages often lead to higher abandonment rates, while quicker load times encourage users to complete their signups. Simply put, optimizing for speed isn't just a technical detail - it’s a key driver for better mobile performance and more successful signups.
How do I prioritize speed fixes that increase conversions fastest?
If you're looking to boost conversions quickly, one of the best places to start is by speeding up load times on mobile devices. Mobile users are especially sensitive to delays, so even small improvements can make a big difference.
To begin, focus on the main culprits behind slow performance. These often include large images, excessive JavaScript, and slow server response times. Tackling these issues can significantly enhance your site's speed.
Here are a few high-impact optimizations to prioritize:
- Compress images: Use tools to reduce image file sizes without sacrificing quality.
- Enable browser caching: This allows returning visitors to load your site faster by storing certain elements locally.
- Minimize JavaScript: Remove unnecessary scripts or combine files to reduce the number of requests.
Once you've made these changes, use A/B testing to measure their effect on conversions. This will help you identify which tweaks deliver the quickest results and where further improvements might be needed.
How can I benchmark my mobile speed against competitors with Competitor Analysis Tool?
The Competitor Analysis Tool offers a way to evaluate your mobile speed by utilizing real user performance data. It compares Core Web Vitals metrics such as Largest Contentful Paint (LCP), Cumulative Layout Shift (CLS), and Interaction to Next Paint (INP). Powered by Chrome User Experience Report (CrUX) data, this tool helps you monitor your site's performance, pinpoint areas for improvement, and identify gaps in demand, messaging, and visibility - no deep SEO knowledge required.