
Common Traffic Benchmarking Mistakes SaaS Teams Make
Avoid common SaaS benchmarking errors—use relevant competitors, actionable metrics, aligned definitions, and intent-driven keywords.

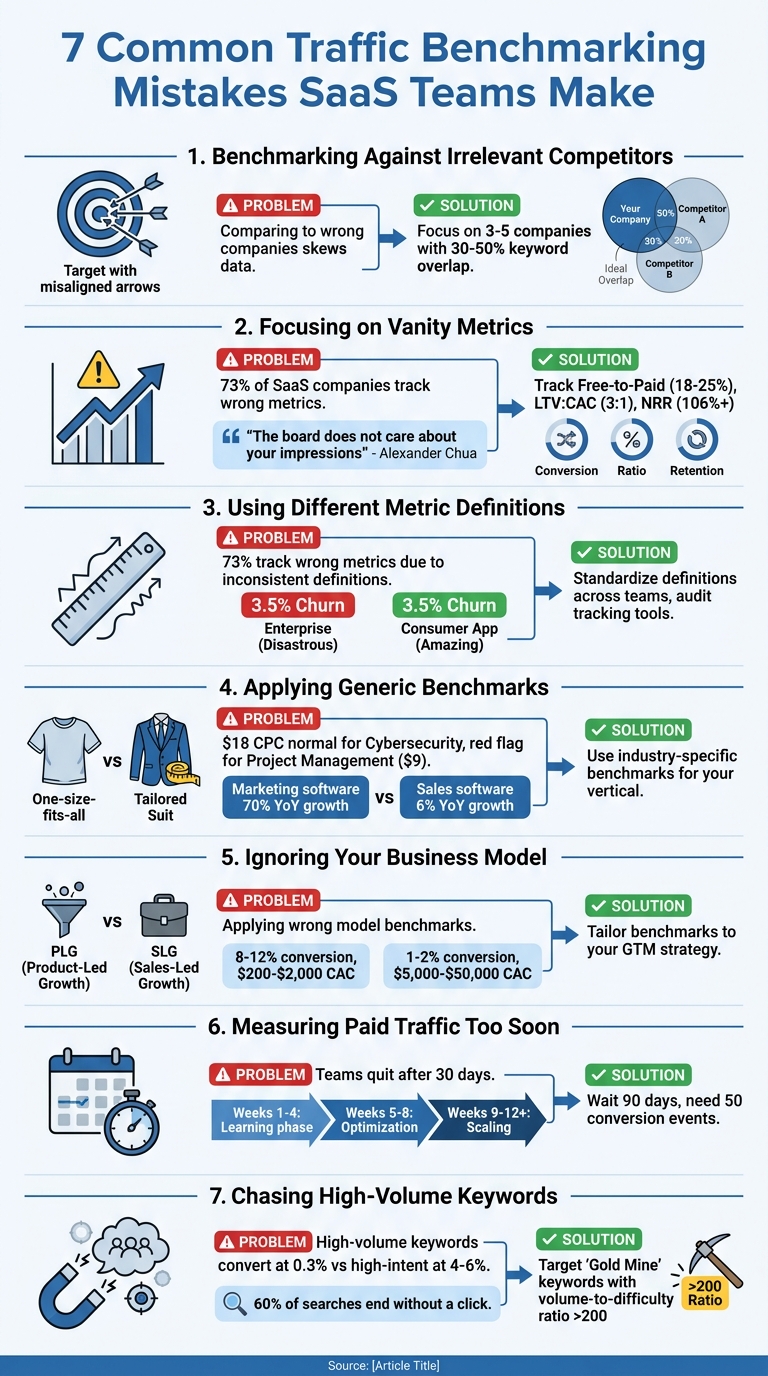
Traffic benchmarking can either guide your SaaS team to success or lead to costly missteps. Many teams fail by focusing on the wrong metrics, comparing themselves to irrelevant competitors, or misunderstanding their own business model. These errors can waste millions annually and derail growth strategies.
Key Takeaways:
- Wrong Competitors: Comparing traffic to irrelevant companies skews data.
- Vanity Metrics: Metrics like total traffic or email opens don't always reflect growth.
- Misaligned Definitions: Inconsistent metric definitions (e.g., CAC, churn) lead to bad decisions.
- Generic Benchmarks: Industry-specific benchmarks matter - don’t rely on averages.
- Business Model Blind Spots: PLG and SLG models require different metrics.
- Premature Paid Traffic Judgments: Campaigns need 90+ days to show results.
- Chasing High-Volume Keywords: Low-volume, high-intent keywords drive better conversions.
Solutions:
- Use tools to analyze competitor websites to identify relevant competitors and search competitors.
- Focus on actionable metrics like conversion rates and LTV:CAC ratios.
- Standardize metric definitions across teams.
- Benchmark against industry-specific data tailored to your vertical.
- Align metrics with your business model (PLG vs. SLG).
- Evaluate paid campaigns after sufficient data collection (90 days minimum).
- Prioritize high-intent keywords over traffic volume.
By addressing these common mistakes, you can turn benchmarking into a reliable tool for smarter decisions and sustainable growth.
7 Common Traffic Benchmarking Mistakes SaaS Teams Make and How to Fix Them
15 Signs You Have A SaaS Metrics Problem (and How to Fix it) with Dave Kellogg
sbb-itb-0a8c96a
Mistake 1: Benchmarking Against Irrelevant Competitors
One common misstep for SaaS teams is choosing the wrong competitors for benchmarking. For instance, comparing your traffic to a massive enterprise player or a company in a completely different industry - just because of some surface-level similarities - can lead to skewed data and misguided strategies. Let’s say you benchmark against a competitor with years of organic growth under their belt. Their numbers will naturally be inflated, making your baseline look weak. Similarly, if a competitor relies heavily on paid acquisition, their traffic will follow a completely different pattern. Even direct competitors might operate under a different business model, and without understanding their strategy, comparing raw traffic numbers can lead to false conclusions about what’s actually working. This initial mistake of picking irrelevant benchmarks often snowballs into more errors down the line.
It’s also important to remember that your competition isn’t limited to direct product rivals. For example, a productivity-focused blog may attract high-intent traffic even though it doesn’t sell a competing product. These are your search competitors - websites ranking for the same keywords your potential customers are searching for. Ignoring this distinction can throw off your traffic benchmarks entirely.
Why Choosing the Right Competitors Matters
Picking the right competitors to benchmark against is crucial. Ideally, you should focus on three to five companies that align with your stage of growth and business model. This mix might include a direct competitor, an aspirational leader in your space, and an adjacent company targeting a similar audience.
A good way to identify relevant competitors is by looking at keyword overlap. If a competitor shares 30–50% of your keywords, they’re worth analyzing. But don’t stop at total keyword volume - pay closer attention to high-intent, transactional terms. This helps you avoid creating false rivalries with websites that aren’t truly competing for your customers. Additionally, consider business model alignment. For instance, a premium brand’s traffic patterns will look very different from those of a budget-focused competitor.
By narrowing your focus to the right competitors, you can set the foundation for more accurate and actionable analysis.
Solution: Use Tools to Find Relevant Competitors
You can tackle this issue effectively with tools designed to identify relevant competitors. Start by asking targeted questions like, “Why are we losing enterprise deals?” This type of focus allows you to zero in on meaningful data.
A competitor analysis framework can simplify this process. In just a couple of minutes, it compares your website against a competitor’s, highlighting demand, messaging, and visibility gaps. It also identifies search competitors - those ranking for your keywords - giving you a broader perspective. Instead of just showing raw traffic numbers, the tool reveals growth trends, which offer a much clearer picture since third-party traffic estimates can vary.
Using the right tools and focusing on relevant competitors ensures your benchmarking efforts lead to actionable insights.
Mistake 2: Focusing on Vanity Metrics
SaaS teams often celebrate numbers that look great on the surface but don’t provide real business insights. Metrics like increased website traffic or a growing email list might seem impressive, but they can create a false sense of achievement. These "up and to the right" trends often have little connection to the actual health of your company.
The problem with vanity metrics is that they fail the "actionability test." When these numbers change, it’s unclear what actions to take. For instance, if your total traffic jumps by 25% but conversions stay flat, it doesn't point to a clear solution. This spike could be due to irrelevant visitors - people who aren’t part of your target audience and have no intention of converting. Similarly, metrics like "time on site" can be misleading. A longer visit might mean users are struggling to find what they need, like the checkout button, rather than being genuinely engaged.
Why Vanity Metrics Don’t Drive Growth
The core issue is that vanity metrics can be manipulated and don’t tie back to revenue. Tactics like using clickbait, purchasing followers, or running homepage ads might inflate numbers, but they won’t help your bottom line or improve customer retention. Alexander Chua, Co-Founder of Growigami, explains:
"The board does not care about your impressions. Sales does not care about your email open rates. And you should not either."
Changes like Apple’s Mail Privacy Protection, introduced in 2021, have also made email open rates unreliable for measuring true engagement. Tracking too many surface-level metrics can create unnecessary "noise", drowning out the data that really matters. This distraction can lead to analysis paralysis. For example, the "shadow success" phenomenon occurs when site visits rise while conversion rates drop, often due to poor audience targeting. To avoid these pitfalls, focus on metrics that directly influence your business outcomes.
Solution: Track Metrics That Matter
To drive growth, shift your focus to data that provides actionable insights. Instead of measuring total traffic, track qualified visitors - users who visit key pages like pricing or start a trial. Swap raw pageviews for metrics like Conversion Rate by Page, which reveals how well your content drives meaningful actions. For email campaigns, move beyond open rates and monitor click-through and reply rates, which better reflect user intent.
When benchmarking traffic, focus on metrics that align with your business model. For example:
- Free-to-Paid Conversion Rate: Free trials typically convert at 18–25%.
- MQL-to-SQL Conversion Rate: A rate below 20% may indicate your lead definition is too broad.
- LTV:CAC Ratio: Aim for a ratio of 3:1 or better.
- Net Revenue Retention (NRR): Companies with NRR above 106% grow nearly three times faster.
A simple way to evaluate any metric is to ask if it’s Actionable (does it guide decisions?), Accessible (can your team understand it?), and Auditable (can it be traced back to real data?). As one analysis puts it:
"If your dashboard doesn't change what the team does Monday morning, it's decoration."
Mistake 3: Using Different Metric Definitions
When your team calculates Customer Acquisition Cost (CAC) differently from your benchmark source, you're setting yourself up for mismatched comparisons. This is a common issue - about 73% of SaaS companies track the wrong metrics, often due to inconsistent definitions across teams and organizations.
The bigger issue isn't just having incorrect numbers; it's being directionally off. Rohit Gupta, Fractional CMO & GTM Strategist, explains:
"Most SaaS teams do not have wrong CAC. They have directionally wrong CAC. That is more dangerous. Wrong numbers can be fixed. Directionally wrong numbers push teams to make confident decisions in the wrong direction".
This kind of misalignment can lead to costly mistakes, like hiring too early, investing heavily in channels that aren't actually working, or cutting budgets for traffic sources that are performing well. Over time, these errors create deeper challenges in maintaining consistent performance measurement.
How Inconsistent Definitions Lead to Problems
Metrics can mean entirely different things depending on how they're defined. Take churn rate, for example: one company might include involuntary churn (like failed payments), while another only counts active cancellations. A 3.5% churn rate could be seen as "amazing" for a consumer app but "disastrous" for an enterprise SaaS business. If you're comparing your numbers to a benchmark that excludes free trial users while your calculation includes them, any conclusions you draw will be meaningless.
CAC has its own set of complications. Some teams count only direct ad spend, while others factor in salaries, agency fees, and tools. Attribution models add another layer of confusion with credit inflation - when multiple channels claim credit for the same conversion. For instance, if a customer interacts with several channels before converting, each channel might take credit, making your ROAS benchmarks look much better than they actually are.
Solution: Standardize Your Metrics
To avoid these pitfalls, you need to standardize how your team defines and measures metrics. Start by creating a shared document that clearly outlines each metric. For example, decide:
- Does "Customer Count" include free-tier users, or only paying accounts?
- Does CAC include just marketing spend, or does it also factor in sales team salaries?
- Do churn calculations account for failed payments?
Make sure everyone on your team agrees on these definitions.
Next, take a close look at the benchmarks you're using. Don’t blindly trust even the most reputable reports. Instead, dig into the methodology: How was the data collected? What metrics were included? When was the sample taken? As KPI Tree warns:
"The most dangerous benchmarks are the ones that are accurate, well-sourced, and completely irrelevant to your situation. A good benchmark applied without judgement is worse than no benchmark at all."
To ensure accuracy, build internal baselines by tracking your own performance consistently over four to six quarters. This gives you a reliable frame of reference before comparing your data to external sources. Use metric trees to break down complex figures like Revenue Growth into smaller components - such as acquisition rate, retention, and ARPU - so you’re analyzing the drivers behind the numbers, not just the top-line results.
| Metric | Definition A | Definition B | Impact on Benchmarking |
|---|---|---|---|
| Churn | Includes involuntary (failed payments) | Only voluntary cancellations | Definition A will always appear worse than B, even if customer satisfaction is identical. |
| CAC | Blended (Organic + Paid) | Paid-only (Direct Ad Spend) | Blended CAC hides the true cost of scaling paid channels. |
| Customer Count | Includes all registered users | Only paying accounts | Including free users artificially lowers CAC and churn rates. |
Lastly, audit your tracking tools regularly. Platforms like Meta or Google Ads often rely on default settings for attribution and lookback windows - these assumptions can skew your data. Without proper oversight, issues like tag decay or mistagging can corrupt up to 20% of your campaign data.
Mistake 4: Applying Generic Benchmarks to Niche SaaS Verticals
Comparing your Cybersecurity SaaS to a generic "SaaS average" can lead to misleading conclusions. For example, an $18.00 CPC might seem high at first glance, but it's completely normal for Cybersecurity. On the other hand, that same $18.00 CPC would be a red flag for Project Management software, where the typical benchmark is closer to $9.00.
This discrepancy goes beyond CPC. Marketing software companies enjoyed 70% year-over-year organic traffic growth in 2024, while Sales software managed only 6%. If you're in the Sales software space and expect 70% growth because you read a general SaaS report, you might think your team is underperforming - even if they're leading the pack in your vertical. These examples highlight why industry-specific benchmarks are essential.
Cassandra Naji, CEO of Campfire Labs, puts it perfectly:
"Generalized content performance benchmarks are about as useful as a screendoor on a submarine."
Why Your Industry Context Matters
Your vertical plays a huge role in defining what "good" performance looks like. For instance, Cybersecurity products typically see landing page conversion rates of 1.8%, while Project Management tools average 4.2%. Why the difference? Selling a $100,000 security solution involves far more deliberation than subscribing to a $50/month collaboration tool.
The same logic applies to cost per SQL (Sales Qualified Lead). DevTools companies average $650 per SQL, while Cybersecurity companies spend around $3,500. This reflects the differences in product value. Ishan Manchanda from GrowthSpree explains:
"The most common mistake is applying low-ACV cost targets to high-ACV products."
If your Annual Contract Value (ACV) is $150,000, spending $3,500 per SQL is perfectly reasonable. But for a $10,000 product, that cost would wreck your unit economics. Generic benchmarks fail to account for these nuances, which can lead to either unnecessary panic over healthy metrics or misplaced confidence in red flags.
Organic traffic growth rates also vary widely. Customer Service software sites pull in 15 million+ monthly visits, yet grow just 11% year-over-year due to market saturation. In contrast, DevTools companies can still achieve 57% growth with tried-and-true SEO tactics. Some verticals, like HR software, even have seasonal trends - traffic spikes between December and January might seem unusual if you're comparing to flat benchmarks.
Solution: Get Industry-Specific Comparisons
To avoid these pitfalls, rely on benchmarks tailored to your vertical. Ditch the one-size-fits-all approach and set realistic targets based on your industry's dynamics. For example, if you're in Marketing software, aim for 6% month-over-month organic growth. In HR or Customer Service, 1% is more realistic. For Sales software, even 0.5% growth can be an achievement.
When assessing paid traffic, align your expectations with vertical-specific metrics. Here's a quick snapshot of benchmarks across different SaaS verticals:
| Vertical | Avg CPC | Avg Conversion Rate | Avg Cost per SQL |
|---|---|---|---|
| Cybersecurity | $18.00 | 1.8% | $3,500 |
| FinTech | $16.00 | 2.2% | $2,800 |
| DevTools | $7.50 | 4.8% | $650 |
| Project Management | $9.00 | 4.2% | $900 |
Tools like the Competitor Analysis Tool (https://competitorscan.io) can help you benchmark your performance against companies in your specific vertical. Instead of relying on irrelevant averages, you can see exactly how you measure up against competitors solving similar problems for similar customers.
Mistake 5: Ignoring Your Business Model
There's a stark difference in how Product-Led Growth (PLG) and Sales-Led Growth (SLG) companies operate, and ignoring these distinctions can lead to big missteps. For instance, PLG companies that offer free trials typically see conversion rates of 8–12%, while SLG companies relying on enterprise demos convert only 1–2% of visitors into leads. If an enterprise-focused company benchmarks itself against PLG metrics, it might mistakenly view its performance as poor, even when its underlying economics are solid.
Take customer acquisition costs (CAC) as another example. PLG companies spend anywhere from $200 to $2,000 per customer, while SLG companies might spend $5,000 to $50,000. This isn't a problem - it simply reflects the different realities of their business models. A PLG company selling a $50/month tool needs low-cost acquisition to stay profitable. On the other hand, an SLG company closing $100,000 contracts can afford to spend significantly more to bring in each customer. This fundamental difference shapes how conversion rates and other metrics should be interpreted.
Alexander Chua, Co-Founder of Growigami, highlights the common misstep founders make:
"The biggest mistake we see is SaaS founders treating PLG and SLG as sequential... PLG-to-sales handoff is an architecture problem, not a hiring problem. If your product does not capture usage signals that feed a PQL model, adding sales later means retrofitting your entire data pipeline."
How Business Models Impact Traffic Performance
Your business model directly influences what "good" traffic looks like. PLG models focus on making it easy for users to get started. Visitors can sign up instantly without speaking to anyone, which leads to higher conversion rates but lower average contract values. SLG models, by contrast, rely on a more hands-on approach. Visitors fill out forms, attend demos, and interact with sales reps, resulting in lower conversion rates but much higher customer value.
This difference ripples through your entire funnel. For example, Product-Qualified Leads (PQLs) in a PLG model typically convert to paying customers at 2–3 times the rate of Marketing-Qualified Leads (MQLs) used in SLG models. However, PQLs only work if your product is designed for self-service. If your product requires a lengthy demo to explain its value, PLG benchmarks won't apply.
Even the same traffic source can perform differently depending on your business model. Organic search, which drives 44.6% of all B2B revenue, behaves differently for PLG versus SLG. A visitor landing on a free trial page might convert right away, while one visiting an enterprise product page could take months to engage - downloading whitepapers, attending webinars, and eventually connecting with sales.
Funding strategies also play a role in shaping priorities. Bootstrapped companies often focus on cash-flow metrics like CAC payback period, while investor-backed firms can prioritize growth-oriented metrics like activation rates. Comparing your performance to companies with different funding models can lead to poor decisions and jeopardize your financial stability.
Solution: Tailor Benchmarks to Your Business Model
The key is to stop comparing yourself to companies with entirely different business models. If you're running a demo-led enterprise tool, benchmark against other demo-led enterprise tools - not free trial or PLG platforms. Break down comparisons by your go-to-market strategy, pricing, and target customer.
Focus on metrics that align with your model. PLG companies should track metrics like Activation Rate and Time-to-Value, while SLG companies need to keep an eye on SQL-to-Close rates and Sales Cycle Length. For instance, a $200,000 Annual Contract Value (ACV) supports a much higher CAC than a $5,000 ACV - generic benchmarks won't capture these nuances.
| Business Model | Ideal ACV Range | Typical CAC | Key Metric to Track |
|---|---|---|---|
| Product-Led Growth | $0 – $15,000/year | $200 – $2,000 | Activation Rate, PQLs |
| Sales-Led Growth | $25,000 – $500,000+ | $5,000 – $50,000+ | SQL-to-Close, Win Rate |
If you're moving toward a hybrid model - using PLG to generate volume while sales teams close enterprise deals - ensure your product is set up to track usage signals. For example, you should identify when a self-serve user hits product limits or activates premium features, then pass that lead to your sales team.
Mistake 6: Measuring Paid Traffic Results Too Soon
Many SaaS teams pull the plug on paid campaigns after just 30 days of underwhelming results. The issue? They’re making decisions before the data has had time to mature. A single month simply isn’t enough to determine whether a paid campaign has the potential to succeed.
The early weeks of any paid campaign can be unpredictable. Platforms like Google Ads typically spend the first 4–6 weeks in what’s called the "learning phase." During this time, the algorithm gathers data, tests bids, and identifies search trends. This phase often brings erratic performance, high cost-per-click (CPC), and minimal conversions. It’s not a malfunction - this is just how the system is designed to work.
Sarah Stemen, President of the Paid Search Association, puts it plainly:
"If your results look inconsistent in the first month, nothing is wrong - this is exactly how the system works."
Making major changes during this learning period - such as cutting budgets by more than 20%, pausing campaigns, or swapping out keywords - can reset the entire process. For B2B SaaS companies, where sales cycles often stretch across 6–12 months, judging a campaign after just 30 days is shortsighted. A click today might not translate into a closed deal for months. Recognizing this early volatility is key to setting realistic expectations for campaign performance.
Why Paid Campaigns Need Time to Mature
The success of a paid campaign is less about weeks on a calendar and more about the data it accumulates. For instance, Google’s smart bidding strategies typically require around 50 conversion events or three full conversion cycles to optimize effectively. Campaigns with smaller daily budgets will naturally take longer to hit these benchmarks.
Most Google Ads accounts need 8–12 weeks before their performance stabilizes. Here’s how the timeline typically unfolds:
- Weeks 1–4: Activation and learning phase, marked by unstable performance and few conversions.
- Weeks 5–8: Optimization phase, where cost-per-acquisition (CPA) starts to improve.
- Weeks 9–12+: Scaling phase, where return on ad spend (ROAS) becomes more consistent.
For B2B SaaS companies, the pipeline impact often becomes noticeable around 6–8 weeks, but calculating a true return on investment (ROI) can take 6–12 months. With sales cycles averaging 84 days and Google’s default 30-day conversion window, much of the revenue generated may initially go untracked.
Solution: Wait Longer to Evaluate Paid Traffic
To avoid premature decisions, commit to a 90-day evaluation period before making any significant changes or shutting down a campaign. This gives the algorithm enough time to exit the learning phase and gather the data needed to identify what’s working.
Once the learning phase is complete, focus on making informed, gradual adjustments. During the first 30 days, avoid drastic changes. Instead, monitor metrics like Impression Share, Click-Through Rate (CTR), and Quality Score trends. These indicators can reveal whether your targeting and messaging are aligned, even if conversions haven’t started to roll in.
A few strategies to keep in mind:
- Apply the Rule of 100 Clicks to analyze performance in larger data sets, smoothing out daily fluctuations.
- When scaling a successful campaign, increase your daily budget by no more than 15–20% at a time to avoid resetting the learning phase.
- Extend your conversion window in Google Ads to 90 days to better track long sales cycles.
- Integrate your CRM with your ad platform to provide real revenue data, allowing you to optimize for pipeline progress and closed deals instead of just form submissions.
Mistake 7: Chasing High-Volume Keywords
High-volume keywords might look tempting because they promise increased traffic. But here's the catch - they rarely lead to conversions. For SaaS teams, this approach often backfires because these keywords tend to attract the wrong crowd: users who are still in the early stages of research and not ready to buy. Think of them as "Fool's Gold." Sure, they inflate traffic numbers, but they don’t drive revenue. For example, a general term like "project management" might pull in 100,000 monthly searches, but most of those users are just gathering information. Now compare that to a more specific search term like "project management software for remote teams", which only gets about 500 searches. Those 500 are far more likely to include people actively looking for a solution. This mismatch is similar to the mistake of focusing on vanity metrics - numbers that look good on the surface but don’t deliver meaningful results.
Here’s a key stat: pages targeting high-intent keywords (those with 100–500 monthly searches) often convert at a rate of 4–6%, while high-volume keywords typically convert at just 0.3%. To make matters worse, about 60% of Google searches now end without a single click because users find answers directly in the search results. When you go after broad, informational keywords, you’re competing for the remaining 40% of clicks - and many of those visitors might leave your page almost immediately.
Why High-Volume Keywords Don't Always Work
High-volume keywords come with three major hurdles:
- Intense Competition: These keywords are dominated by big-name brands with high domain authority, making it tough for smaller SaaS companies to rank.
- Misaligned Intent: The intent behind broad keywords often doesn’t match conversion goals. For example, someone searching "what is CRM" is likely just researching, whereas "best CRM for real estate agencies under $50/month" signals someone ready to buy.
- Unreliable Data: SEO tools often miscalculate keyword volume, with error rates as high as 37%. A keyword that seems to have 10,000 monthly searches might actually get closer to 6,000. And even then, many high-volume searches are satisfied by Google’s featured snippets or knowledge panels, reducing the actual traffic you can capture.
Instead of chasing raw search volume, focusing on user intent can align your strategy with measurable growth. This shift ties back to the broader principle of prioritizing quality over vanity metrics.
Solution: Target Keywords Based on User Intent
As THE SEO ENGINE Editorial Team puts it:
"Stop asking 'what's the volume?' Start asking 'what's the volume of people I can actually help?'"
The winning strategy? Focus on user intent, not just search numbers. Start by categorizing keywords based on the buyer's journey: Informational, Investigational, or Transactional.
Ross Simmonds, Founder of Foundation Marketing, suggests targeting what he calls "Gold Mine" keywords - lower-volume, high-intent terms that are easier to rank for and more likely to convert. A good starting point is analyzing your top 20 converting pages to discover the keywords already driving revenue. These often fall in the mid-volume range of 500–2,000 searches.
Another effective tactic is calculating the volume-to-difficulty ratio by dividing a keyword’s search volume by its difficulty score. Ratios above 200 typically indicate the best opportunities. Finally, don’t underestimate the power of low-volume keywords. A term with just 200 searches can generate 2,000 to 5,000 impressions through related long-tail queries. This underscores why intent-driven strategies outperform the pursuit of vanity metrics.
How Competitor Analysis Tool Fixes These Problems
Competitor Analysis Tool tackles common benchmarking challenges by offering sharp, targeted insights that help correct strategic missteps. Many SaaS teams struggle with juggling multiple tools to gather competitive data. This platform simplifies the process, delivering clear, actionable insights in just minutes - no SEO expertise required.
By directly comparing your website to competitors, the tool automatically identifies demand, messaging, and visibility gaps. It provides clear recommendations that highlight where you're falling short and what to do next. This is critical because sellers face direct competitors in 68% of deals, yet most teams rate their competitive readiness at just 3.8 out of 10.
Compare Against the Right Competitors
Accurate benchmarking starts with focusing on the right competitors, and the tool ensures this by separating them into categories. It distinguishes between direct competitors (those offering the same product) and search competitors (those ranking for the same high-intent keywords you're targeting). This approach prevents confusion and ensures your comparisons are meaningful.
The tool uncovers visibility gaps across organic, paid, social, and referral channels. For instance, in 2025, Ukrainian e-commerce leader Kasta.ua used competitive traffic insights to refine its marketing strategy, resulting in 2.5× traffic growth within six months. Similarly, Bricomarché, a leading DIY retailer, achieved a 41% boost in online sales by addressing key visibility gaps using benchmarking insights.
Get Clear Insights Without SEO Knowledge
The platform makes complex data easy to understand, even for non-technical teams. Designed with simplicity in mind, it provides insights that anyone can act on. As Shuai Guan, Co-founder/CEO of Thunderbit, explains:
"You don't need to be a data scientist (or even a spreadsheet wizard) to get started."
With color-coded labels - green for strengths and red for gaps - the tool visually highlights areas that need attention. This intuitive design helps you quickly see which strategies are working and where to focus your efforts. From day one, you can start making data-driven decisions to capitalize on growth opportunities and drive results.
Conclusion
Mistakes in benchmarking can cost SaaS teams millions. The seven errors discussed - from comparing yourself to the wrong competitors to focusing on high-volume keywords - share a common cause: relying on incomplete or generic data that doesn’t fit your business. Consider this: sellers face direct competitors in 68% of deals but rate their competitive preparedness at just 3.8 out of 10. That’s a massive gap between perception and reality.
These recurring issues highlight the importance of tailoring your benchmarking approach to reflect your specific business needs and goals.
Accurate benchmarking that considers your unique context is the backbone of any effective growth strategy. As Ibby Syed, Founder of Cotera, wisely states:
"If you can't connect a metric to a decision you'd make differently, drop it from the dashboard".
This means focusing on metrics that matter - like growth rates and channel performance - while avoiding distractions like vanity metrics or raw traffic numbers. It also requires segmenting data by user intent instead of lumping all visitors together.
The difference between thriving teams and struggling ones often comes down to how they measure success, not just what they measure. For instance, nearly 68% of businesses that abandon their content strategies by month four are making decisions based on flawed data, inconsistent definitions, or tracking errors - not actual performance problems. Addressing these issues starts with adopting smarter, context-driven measurement practices.
FAQs
How do I pick the right competitors to benchmark?
Pick competitors that match your business goals and share similarities in size, market focus, or product offerings. Look for those with accessible and reliable data as well as relevant growth patterns or challenges. By examining their traffic trends and performance metrics, you can uncover insights to answer critical questions - like how their SEO strategies perform or why deals might be slipping through your fingers.
To make your analysis meaningful, focus on competitors whose metrics closely align with your own strategic priorities. This ensures your comparisons are both useful and actionable.
What traffic metrics actually predict revenue for my SaaS?
Traffic metrics that are closely tied to revenue for SaaS businesses include customer acquisition cost (CAC), steps within the conversion funnel, cohort analysis, and engagement metrics. These focus on user behaviors that directly drive subscriptions or renewals, offering a more actionable perspective compared to simple traffic counts.
When should I judge a paid campaign as working or not?
When you notice a significant drop in Return on Ad Spend (ROAS), it's a clear sign that your paid campaign isn't performing as expected. A lower ROAS means your revenue is shrinking relative to your costs, which is never a good sign. At this point, it's time to take action - whether that means fine-tuning the campaign or conducting a thorough review to pinpoint and resolve the problem.