
How to Build a Competitor Feature Comparison Framework
Guide to build and maintain a competitor feature comparison matrix: set goals, pick rivals, score features, analyze gaps, and act.
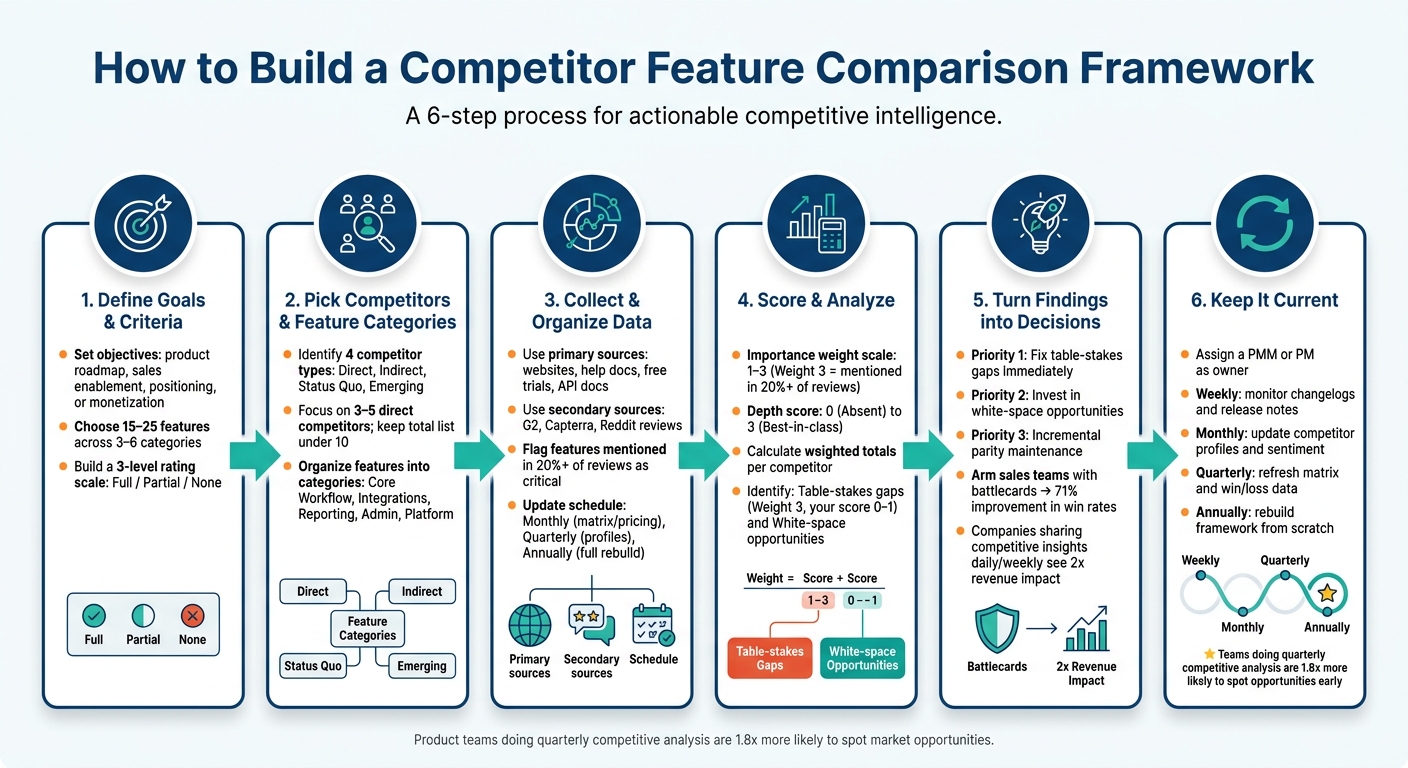
Building a competitor feature comparison framework helps SaaS teams understand how their product stacks up against competitors. This process identifies gaps, reveals opportunities, and aligns teams with actionable data. Here's a quick breakdown of how to create one:
- Define Goals and Criteria: Set clear objectives (e.g., improving sales, updating roadmaps). Focus on features buyers care about, not just internal outputs.
- Pick Competitors and Features: Identify direct, indirect, and emerging competitors. Organize features into logical categories (e.g., Core Workflow, Integrations).
- Collect and Score Data: Use reliable sources like competitor websites, reviews, and trials. Rate features on a simple scale (e.g., Full, Partial, None).
- Analyze Results: Spot critical gaps and opportunities. Prioritize features that matter most to customers.
- Apply Insights: Update your product roadmap, refine pricing, and equip sales teams with battlecards.
- Keep It Updated: Regularly review and refresh your framework to ensure relevance.
Quick Tip: A transparent, well-maintained framework drives better decisions and improves competitive preparedness. Start small, update often, and focus on actionable outcomes.
How to Build a Competitor Feature Comparison Framework: 6-Step Process
Video 6: Building a Competitive Feature Comparison Matrix
Step 1: Define Your Goals and Comparison Criteria
Start by clarifying your purpose. Without clear objectives, your framework risks becoming just another unused spreadsheet. Well-defined goals not only guide your criteria selection but also ensure your rating system is meaningful and actionable.
Set Clear Goals
Think about what you want to achieve. Common goals might include: shaping your product roadmap, strengthening your market positioning, equipping your sales team, or adjusting pricing and packaging strategies. Each of these goals requires a unique approach and leads to different outcomes.
| Goal | What You're Trying to Answer | Output |
|---|---|---|
| Product Strategy | Where are we missing must-have features? | Roadmap priorities, gap list |
| Sales Enablement | How do we handle objections in competitive deals? | Battlecards, talk tracks |
| Positioning | What value prop isn't already claimed by a competitor? | Messaging updates, homepage copy |
| Monetization | Is our pricing causing us to lose deals or customers? | Tier restructure, feature gate changes |
Here’s a helpful tip: every goal should tie directly to an actionable outcome. For example, a vague goal like "understand the market" won’t get you far. Instead, aim for something specific, like "identify which features are costing us deals against Competitor X." Goals like this translate into strategic actions for product development, sales strategies, and pricing adjustments.
Choose Your Comparison Criteria
Once your goals are clear, shift your focus to the criteria that matter most. Avoid basing these solely on internal engineering outputs. Instead, prioritize what your buyers care about. Start by gathering data - review 50 recent customer reviews for your product and your competitors on platforms like G2 or Capterra. Tag and count feature mentions, and flag any features that appear in at least 20% of reviews as critical.
Group your criteria into 3–6 logical categories - examples include Core Workflow, Integrations, Reporting, and Admin & Security. Keep the total list manageable, ideally between 15–25 capabilities. Overloading the matrix with too many items makes it cumbersome to maintain and harder to act on. For pricing, track specific numbers like entry-level plans (e.g., $12/seat/month), mid-tier plans (e.g., $79/month flat), annual discounts (15%–20% is typical), and features locked behind premium tiers.
"The problem is not the format. Matrices are powerful analytical tools. The problem is what goes into them: features chosen by internal teams rather than buyers." - Compttr
Build a Rating System
Now that you know what to measure, create a consistent way to rate each feature. Simplicity is key. A straightforward 3-level scale often works well, especially when you need to share the results with sales teams or non-technical stakeholders:
| Score | Meaning | What It Looks Like |
|---|---|---|
| Full | Fully Supported | Production-ready, documented, included in standard plans |
| Partial | Limited Support | In beta, enterprise-only, or has notable gaps |
| None | Not Available | Feature doesn’t exist or requires manual workarounds |
For more nuanced decisions, such as product roadmaps, a weighted 1–5 scale can provide additional depth. On this scale, 5 represents best-in-class capability, while 1 signals minimal functionality. Whatever system you choose, define what each level means before you start scoring. This avoids inconsistent ratings caused by personal interpretation.
Step 2: Pick Your Competitors and Define Feature Categories
Once you've set your goals and rating system, the next step is deciding who and what to compare. This involves selecting the right competitors and organizing feature categories to ensure your analysis is both accurate and actionable.
Select the Right Competitors
Start by asking yourself: "If our product didn’t exist, what would our customers choose instead?". This question helps you identify not just direct competitors but also indirect solutions, manual alternatives, and potential emerging threats.
Competitors can be grouped into four main types:
| Competitor Type | Definition | Why It Matters |
|---|---|---|
| Direct | Offers a similar product to the same audience at comparable pricing | Win/loss data here is often the most useful |
| Indirect | Solves the same problem using a different method | These competitors often grow quickly and can disrupt your market |
| Status Quo | Includes spreadsheets, manual processes, or doing nothing | Commonly overlooked, especially by SaaS startups |
| Emerging | New startups or adjacent products expanding into your space | Important for long-term planning and staying competitive |
"The status quo is a competitor. A project management startup that only compares itself to Asana and Monday.com is missing the fact that 60% of its prospects are using shared Google Docs." - Gregory Shepard, Founder and CEO, Startup Science
To finalize your competitor list, cross-check it with win/loss data from your sales team - 68% of sales opportunities involve a named competitor. Also, review G2 and Capterra category listings to spot any rising players you might have overlooked. Aim to focus on 3–5 direct competitors for in-depth analysis, and keep the total list under 10 to avoid becoming overwhelmed.
Standardize Feature Categories
After identifying your competitors, the next step is to organize and standardize the feature categories for comparison.
Structure these categories around customer workflows, and aim to include 15–25 features. For most SaaS products, a good framework might include:
- Core Workflow
- Integrations
- Reporting & Analytics
- Administration
- Platform & Support
Including more than 30 features can make the analysis unwieldy and harder to interpret.
Document Your Assumptions
Before diving into scoring, take the time to document your assumptions. Scoring can be subjective - two people might rate the same feature differently by an entire point. Writing down your criteria ensures consistency and clarity.
Define what qualifies a feature as "Full" versus "Partial." For instance, does a feature count as "Full" if it’s only available on an Enterprise plan? Should beta features be marked as "Partial" or "None"? These distinctions matter because they directly impact how the analysis is used by your sales team. If you can’t verify a feature through a free trial, documentation, or changelogs, mark it with a question mark. Clear guidelines help ensure the results are credible and actionable.
"A comparison that shows you winning on every dimension will not be believed. Honest acknowledgment of competitor strengths... is more credible than a one-sided comparison." - Digital Codex
Step 3: Collect and Organize Feature Data
Now that you’ve chosen your competitors and outlined feature categories, the next step is gathering accurate, actionable data. This part is crucial - your decisions will only be as good as the data you collect.
Find Reliable Data Sources
To build a trustworthy comparison matrix, start with primary sources like competitors' websites, help centers, API documentation, and release notes. These are the most direct and dependable places to find information.
Marketing copy alone won’t cut it. Whenever possible, sign up for free trials to see the product firsthand. For technical claims, such as security or compliance features, have two separate analysts verify each data point before adding it to your matrix.
"The website is marketing; the product is the truth. For sales-led tools, request demos; many features that appear in the matrix as 'strong' are gated demos that actually under-deliver." - AI Tools Guidebook
Secondary sources can add depth to your findings. Platforms like G2 and Capterra often highlight how features perform in real-world scenarios. Pay close attention to features mentioned in at least 20% of reviews - they’re likely high-priority. Reddit is another goldmine for unfiltered opinions. Searching site:reddit.com [competitor name] can uncover candid user feedback that formal review sites might miss.
If you’re using AI tools to speed up your research, proceed with caution. AI-generated data can be flawed. Use AI to structure your matrix, but always manually verify feature claims against live sources.
Once you’ve gathered and validated your data, make sure it stays up-to-date with regular reviews.
Verify and Refresh Your Data
SaaS products evolve constantly. A feature marked as "Partial" a few months ago might now be fully functional - or quietly removed. That’s why keeping your data both accurate and current is equally important.
Here’s a practical update schedule:
| Frequency | What to Update |
|---|---|
| Monthly | Feature matrix, pricing tiers |
| Quarterly | Full competitor profiles, positioning, SWOT analysis |
| Annually | Rebuild the entire framework to eliminate outdated or commoditized features |
Timestamp every data point to track its recency. Set up Google Alerts for competitor names and product updates to catch major changes between scheduled reviews.
Build a Comparison Matrix
Once your data is verified, organize it into a comparison matrix. Use rows for features and columns for competitors (including your own product). This format makes it easy to spot gaps and strengths at a glance.
Avoid oversimplifying with Yes/No checkboxes. Instead, provide details like whether a feature requires extra configuration or works immediately.
"A feature matrix that says 'both have automation' misses the fact that one requires a CS degree to configure and the other takes 30 seconds." - IdeaPlan
For added transparency, link each cell to supporting evidence, such as screenshots, help docs, or trial recordings. This creates a source of truth your team can rely on. Also, include a column for implementation depth (e.g., "available on all plans" vs. "Enterprise only") to reflect real-world conditions, not just the existence of a feature.
sbb-itb-0a8c96a
Step 4: Score and Analyze the Framework
Now that your comparison matrix is ready and the data has been verified, it’s time to turn those numbers into insights. This step is all about scoring and analyzing the data to understand what truly matters to buyers and where your product stands against competitors.
Build a Scoring Model
Just like in the data collection phase, it’s important to document the scoring criteria to maintain consistency over time. Each feature impacts buyers differently, so assign greater weight to those that are most important. Use an importance weight scale from 1 to 3:
- Features mentioned in over 20% of reviews get a Weight 3.
- Features cited in less than 5% of feedback receive a Weight 1.
Next, evaluate each product using a 0–3 depth scale:
| Score | Label | What It Means |
|---|---|---|
| 3 | Best-in-class | A standout feature that differentiates the product |
| 2 | Competitive | Meets the standard expectations of buyers |
| 1 | Basic | Exists but may require workarounds |
| 0 | Absent | Not available |
To ensure consistency, clearly define what each score (especially a "3") represents for every feature. As the Elevated Signal Research Team explains:
"Writing 'good UI' in a cell tells you nothing in six months. Scoring it 4 out of 5 with a note about why lets you track changes over time."
Stay objective. Internal bias can lead to overrating your product, so rely on hard evidence like documentation, trial recordings, or demo sessions - not gut feelings - to assign scores.
Once the scoring is complete, you can use the results to objectively compare your product to the competition.
Read the Results
After scoring, calculate a weighted total for each competitor by multiplying the depth score of each feature by its importance weight. This single number allows for an apples-to-apples comparison.
From there, focus on two critical areas:
-
Table-stakes gaps: These are high-importance features (Weight 3) where competitors score a "3" (best-in-class) while your product lags with a "0" or "1." Addressing these gaps should be a top priority. As Compttr puts it:
"A table-stakes gap means you are being eliminated from deals before you get a chance to differentiate. No amount of excellence in other areas compensates for missing a feature that buyers consider mandatory."
- White-space opportunities: These are features with high importance where no competitor scores a "3." These areas present opportunities to stand out with minimal competition.
You can also calculate a Feature Advantage Index for any feature using this formula:
(Your Depth Score − Best Competitor Depth Score) × Importance Weight.
A positive score indicates a clear lead, while a negative score highlights a vulnerability that needs attention.
Use Tables to Visualize Findings
Tables make it easier to interpret your findings. Lay out features as rows, competitors as columns, and display weighted totals at the bottom. Here’s an example:
| Category | Feature | Weight | Your Product | Competitor A | Competitor B |
|---|---|---|---|---|---|
| Core Workflow | Feature 1 | 3 | 3 (9) | 2 (6) | 1 (3) |
| Integrations | Feature 2 | 2 | 2 (4) | 3 (6) | 2 (4) |
| Reporting | Feature 3 | 3 | 1 (3) | 3 (9) | 2 (6) |
| Weighted Total | 16 | 21 | 13 |
(The numbers in parentheses represent the depth score multiplied by the weight.)
This type of table highlights strengths and weaknesses, showing where your product leads, where it lags, and where the market might not be meeting buyer needs. By presenting the data visually, you create a resource that remains useful long after this initial analysis.
Step 5: Turn Findings into Decisions
A framework only becomes useful when it leads to action. As the Seeto team aptly notes:
"The failure mode is not incomplete information... The failure is structural: the template ends with a summary, not a commitment."
With your analysis complete, it's time to translate those insights into concrete steps.
Feed Insights into Your Product Roadmap
Using the gaps highlighted in your feature matrix, organize your findings into three key priorities:
| Priority | Feature Type | Action |
|---|---|---|
| 1 | Table-stakes gaps | Address immediately - these are critical for survival |
| 2 | White-space bets | Invest strategically to stand out in the market |
| 3 | Parity maintenance | Make incremental updates to stay competitive |
Estimate the potential revenue or retention impact of each gap. Interestingly, only 35% of product teams conduct win/loss interviews systematically. Even a small number of these interviews can uncover actionable insights to turn lost deals into wins.
Adjust Pricing and Packaging
Once your roadmap is updated, revisit your pricing strategy. Map out how competitors structure their feature tiers. If a competitor charges for a feature you provide for free, it can be a strong selling point. On the flip side, if they offer something free that you charge for, it could lead to customer churn and needs immediate attention. Also, consider reevaluating your pricing model. For example, per-seat pricing and usage-based pricing affect customers differently as they grow.
Arm Your Sales Team
Sales teams often face challenges in staying prepared against competitors. Equip them with a one-page battlecard summarizing your key findings. This battlecard should include:
- A concise positioning statement
- A comparison table (5–7 rows) focusing on criteria buyers care about
- One compelling proof point
Sales teams using battlecards have reported a 71% improvement in win rates. Additionally, companies that share competitive insights regularly - daily or weekly - see a 2x revenue impact compared to those who share them sporadically.
Add Competitor Analysis Tool to Your Process
With your framework in place, consider using the Competitor Analysis Tool to uncover areas that manual research might miss. This tool compares your website against a competitor's, identifying demand, messaging, and visibility gaps. It highlights high-intent keywords driving competitor traffic and explains why their positioning may resonate better with visitors. These insights can enhance your white-space analysis and refine your sales team’s messaging during conversations. Best of all, the tool provides a free analysis in under two minutes and doesn’t require any SEO expertise.
Step 6: Keep the Framework Current
Once your competitive insights are driving key decisions, the next challenge is ensuring your framework stays relevant. This isn't a "set it and forget it" kind of task - it requires ongoing attention. As Compttr aptly puts it:
"A feature comparison matrix has a shelf life. Competitors ship new features. Buyer priorities shift. Review sentiment evolves. A matrix that is six months old is misleading rather than informative."
Without regular updates, even the most detailed framework can quickly lose its value and, worse, lead to misinformed decisions.
Assign Ownership
To keep your framework in top shape, assign a Product Marketing Manager (PMM) or Product Manager (PM) as the main point of contact. This person will oversee updates, manage data accuracy, and ensure findings are shared with the right people.
But don’t stop there - make it a team effort. Assign specific competitors to individual team members. For instance, one person can monitor Competitor A's product updates, while another keeps an eye on Competitor B's pricing changes. A #competitive-intel Slack channel can be a great way to centralize updates. Anyone on the team can drop in news about feature launches or pricing shifts, turning competitive monitoring into a shared responsibility rather than a solo task. This approach also smooths transitions if the primary owner changes roles.
Once roles are in place, set up a structured review process to keep everything on track.
Set a Review Schedule
Keeping your framework reliable means committing to regular updates. Organize these updates based on the type of data and its importance. Here’s an example schedule:
| Frequency | Focus | Action |
|---|---|---|
| Weekly | Market signals | Monitor competitor changelogs, release notes, and review platforms. |
| Monthly | Profiles & sentiment | Update competitor profiles and gather review insights. |
| Quarterly | Strategic alignment | Refresh the feature matrix, positioning maps, and win/loss data. |
| Annually | Framework integrity | Rebuild the framework from scratch, removing outdated features. |
This schedule ensures you’re not just collecting data but also keeping it actionable. For example, product teams that perform competitive analysis on a quarterly basis are 1.8x more likely to spot market opportunities before their competitors.
Beyond routine updates, be ready to act whenever major events occur - like a competitor raising funding, launching a significant feature, or adjusting pricing. These moments can shift the competitive landscape in an instant.
Use Standard Templates
Consistency is key when multiple people contribute to the framework. Use standardized templates for competitor profiles, feature matrices, and pricing comparison tables. Each entry should include the competitor’s name, the data point, its source, and the date it was collected.
As Compttr wisely notes:
"A partially filled competitive analysis template that gets updated monthly is worth infinitely more than a comprehensive one that collects dust."
Store everything in a shared workspace, like Notion or Google Sheets, to keep it accessible and version-controlled. This way, the framework remains useful and easy to update, even as team members change or priorities shift.
Conclusion: Making Competitor Feature Comparison a Repeatable Process
A competitor feature comparison framework isn’t something you create once and forget about - it’s an ongoing system that should adapt as your business evolves.
The steps we’ve outlined - setting clear goals, identifying the right competitors, gathering trustworthy data, scoring your findings, and applying those insights to real decisions - only work if they’re done regularly. Repeating this process over time amplifies its value. What sets apart a framework that drives results from one that gets ignored boils down to three essentials: clear ownership, a regular review schedule, and effective sharing across teams. Build these habits into your workflow to ensure competitive insights stay actionable and impactful.
"The companies winning competitive deals aren't the ones with the best products. They're the ones with the best understanding of how their product compares - and the discipline to act on that intelligence consistently." - Swapnil Biswas, Product Marketing & Growth Strategist
This guide emphasizes that the goal isn’t to create a flawless, all-encompassing document. Instead, focus on building a process centered around ownership, routine updates, and team-wide collaboration. Start with a framework you can update monthly - consistency is far more effective than an overly detailed system that no one uses. Establish the habit first, and fine-tune the process as your business grows.
FAQs
Which competitors should I include in my framework?
To create a strong framework, narrow your focus to 3–5 direct competitors targeting the same audience with similar solutions. Don’t stop there - include indirect competitors (those solving the problem in a different way), substitute competitors (offering alternative solutions), and emergent competitors (new players entering your market). Keeping the analysis concise prevents information overload and ensures your insights remain actionable. Pay special attention to competitors attracting your target customers to fine-tune your growth strategy.
How do I score features without bias?
To maintain fairness in feature scoring, it's a good idea to involve 2–3 team members and calculate the average of their scores. Ratings should be grounded in tangible evidence - think customer interviews, review data, or sales insights - rather than personal opinions. A standardized rubric with clear definitions ensures consistency across evaluations. Once your scoring is complete, test its reliability by tweaking weights or scores slightly. If your conclusions hold steady, it’s a good sign that your results are solid.
How often should I update the comparison matrix?
Updating your feature matrix every quarter is a smart move to stay in tune with shifting competitor strategies, market trends, and customer expectations. Keeping it static risks relying on outdated information. While certain aspects, like review data, might require monthly attention, revisiting and refining the core matrix every three months ensures it remains accurate and actionable. Tools such as the Competitor Analysis Tool can simplify this process, helping you track changes effortlessly and keep your matrix up-to-date.