
Competitor Traffic Sources: What to Benchmark
Channel mix reveals if competitors earn demand, buy it, or rely on fragile partnerships—benchmark share, intent, landing pages, and trend shifts.

If I only benchmark one thing beyond total traffic, I benchmark source mix. It tells me whether a competitor wins through brand demand, Google, ads, partners, social reach, or email. And because third-party traffic estimates can be off by 30% to 50%, I focus on share, patterns, and shifts instead of exact visit counts.
Here’s the short version:
- Direct shows likely brand demand, repeat visits, and possible tracking gaps
- Organic search shows discovery, search intent, and SEO depth
- Paid search/media shows where competitors spend money to get buyers
- Referral shows which sites, partners, and review platforms send visits
- Social shows distribution by platform, not just traffic volume
- Email shows signs of an owned audience and repeat engagement
What I look for first:
- Channel share: Which sources drive the biggest slice of traffic?
- Intent: Are visits going to blog posts, comparison pages, or pricing?
- Source quality: Is traffic broad-based or dependent on one source?
- Trend changes: Did a channel jump, drop, or shift over the last 6–12 months?
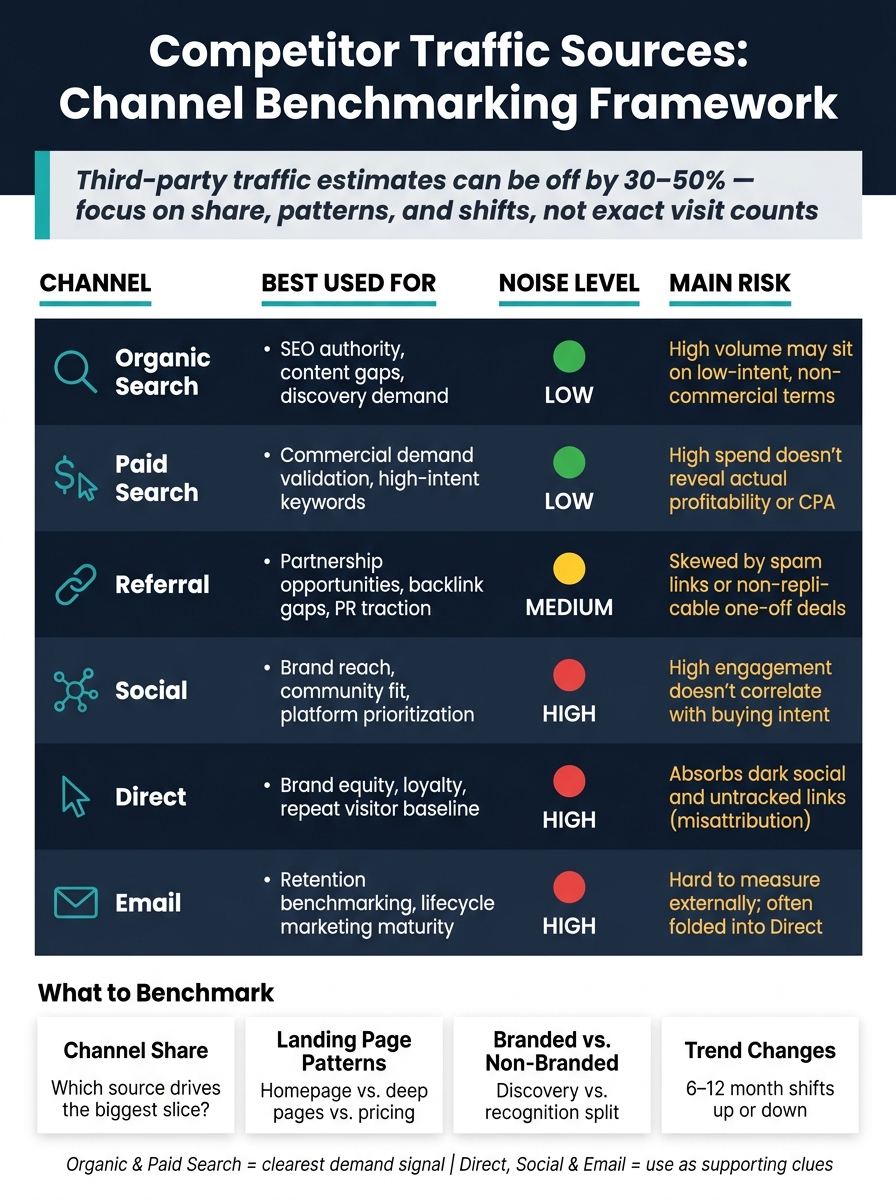
Competitor Traffic Sources: Channel Benchmarking Framework
How to Find Competitors’ Best Traffic Sources in Similarweb Then Copy the Strategy
Quick Comparison
| Channel | What I Benchmark | What It Usually Tells Me | Main Risk |
|---|---|---|---|
| Direct | Share, homepage vs. deep-page landings | Brand demand, loyalty, or misattribution | Dark social and untagged traffic |
| Organic Search | Branded vs. non-branded, page types, subfolder growth | Discovery and SEO focus | High traffic with weak buyer intent |
| Paid Search / Media | Paid share, ad overlap, landing pages, brand bidding | Where budget is going and what may convert | Spend does not show profit |
| Referral | Top domains, landing pages, source concentration | Review sites, partners, PR, affiliates | Too much weight on one source |
| Social | Platform mix, landing pages, traffic spikes | Distribution engine and audience fit | Attention without buying intent |
| Traffic share, deep-page clicks, trend stability | Owned audience and lifecycle motion | Hard to measure from the outside |
My rule: organic and paid usually give the clearest signal, while direct, social, and email need more caution. The goal is not to guess exact traffic. The goal is to see how competitors get demand and where their weak spots are.
That’s the frame I’d use before drilling into each traffic source.
1. Direct Traffic
Direct traffic means visits with no referrer data. That usually includes typed URLs, bookmarks, or untagged links. It’s a handy signal for brand recognition and audience loyalty.
Traffic Share
A high share of direct traffic often points to brand equity, repeat visitors, or offline and PR activity. SEO consultant Mike Bastin puts it this way:
"High direct traffic share [signals] strong brand equity, repeat audience, probably offline or PR investment."
There’s one catch. Clicks from untagged links in apps, email, or private messages can also end up under direct traffic. So if the share looks high, that doesn’t automatically prove strong brand demand.
Conversion Contribution
Direct visitors often convert at a higher rate because they already know the brand. They’re not meeting you for the first time. They’ve likely heard of you before, visited before, or came back on purpose.
Landing Page Patterns
Landing-page depth helps you tell the difference between true direct demand and traffic that was simply misclassified.
If most direct visits land on the homepage, that’s a stronger sign of brand recall. People knew where they wanted to go, so they went straight there. If a lot of direct traffic lands on deep pages, though, that can hint at untagged shares from places like:
- Chat apps
- Private communities
That’s the kind of detail that keeps you from reading too much into one traffic source.
Strategic Signals
It helps to track spikes in direct traffic next to branded search. When both go up at the same time, brand demand is more likely the reason. If only direct traffic jumps, there’s a good chance some of that traffic was misattributed.
Next, compare organic search to see whether competitors lean more on brand demand or discovery.
2. Organic Search Traffic
If direct traffic tells you a brand has pull, organic search tells you something else: whether competitors are winning discovery at scale.
When a competitor gets 40% or more of total traffic from organic search, that usually points to a durable content engine. So don’t just look at raw traffic. Compare organic source mix, search intent, and which visits are most likely to turn into revenue.
Traffic Share
Compare branded and non-branded organic traffic. Branded search points to recognition. Non-branded search shows discovery.
That split matters more than it may seem at first glance. A company can look strong in search, but if most of that traffic comes from people already searching for its name, the growth story is different. Non-branded traffic shows whether they’re meeting buyers earlier, before a decision is made.
Conversion Contribution
Organic traffic matters most when it lands on pages that can convert, like pricing, comparison, and alternatives pages.
Commercial searches such as pricing, comparisons, and alternatives tend to drive pipeline, while informational content tends to drive volume. That’s the big difference. A “what is” post may bring in a lot of visitors, but a pricing or “vs” page often brings in people who are much closer to action.
Landing Page Patterns
Look at which page types bring in the most organic traffic. Pages like calculators, templates, guides, and comparisons can show where a competitor is pushing decision-stage traffic.
This is where patterns start to tell a story. If a rival gets lots of traffic from educational content but has weak pricing or comparison pages, that gap can be a gift.
"If they dominate 'how-to' queries but have nothing strong on 'pricing', 'vs' or 'alternatives' terms, the bottom of funnel is wide open for you." - Mike Bastin, SEO Consultant
Strategic Signals
Sudden spikes often point to a new content cluster or a search algorithm update. Track subfolder growth too. Fast-growing sections like /blog/, /products/, or /tools/ show where they’re putting acquisition effort.
A sharp lift in /tools/ might mean they’re leaning into free utilities. Growth in /products/ could mean they’re tying search more closely to revenue pages. And if /blog/ is doing all the heavy lifting, you’ll want to check whether that traffic is moving users any closer to conversion.
Use these signals to judge earned demand, then compare paid search to see where competitors are buying growth instead of earning it.
3. Paid Search and Paid Media Traffic
Paid traffic is one of the clearest signs that a competitor has found keywords or offers that lead to action. If a rival is paying for traffic, they’re showing you which keywords, offers, and audiences they think convert. Unlike organic traffic, paid traffic makes it clear where they’re putting budget.
Traffic Share
A high paid-search share often points to a tested keyword set and a repeatable way to win customers. Compare paid and organic traffic to see if they’re buying growth or earning it. A brand that leans hard on paid traffic but has weak organic reach can move fast, but it’s exposed.
"Heavy dependence on paid search or social can drive fast short-term traffic, but it also raises cost risk."
Two metrics deserve close attention: impression share and overlap rate. Impression share shows how often they appear out of all eligible impressions in Google Ads auctions. Overlap rate shows how often you and a competitor appear in the same auction.
Share shows scale. Conversions show whether the spend is paying off.
Conversion Contribution
Ads that stay live for 30+ days without creative changes often point to strong performance. It also helps to study the keywords they’re bidding on. Competitors paying for "pricing", "vs", or "alternatives" terms are going after buyers who are close to making a choice. That’s bottom-of-funnel spend, and it’s rarely random.
Landing Page Patterns
Don’t stop at the ad. Follow the click to the page. See whether paid traffic lands on a dedicated campaign page or a generic product page. More pages per session or longer time on page can point to higher-intent traffic.
The landing page shows the offer. The traffic pattern shows the plan.
Strategic Signals
Keep an eye on brand bidding. If a competitor is paying to appear when someone searches your company name, that’s an aggressive move worth taking seriously. They’re trying to intercept your branded demand.
A sudden drop to zero can say just as much.
"A competitor whose paid traffic dropped to zero just killed their ad budget, maybe because it wasn't converting." - Ibby Syed, Founder, Cotera
You can also use the Google Ads Transparency Center, Meta Ad Library, and TikTok Ad Library to check current creative, offers, and channel focus. If the same message keeps showing up across channels for weeks, that usually points to an angle that’s working and worth benchmarking.
Paid traffic shows where competitors buy demand; referral traffic shows who helps amplify it.
4. Referral Traffic
Referral traffic shows which sites send visitors to a competitor. It also helps confirm whether those visits matter.
When another site links to a competitor and people click through, that usually points to trust, a business relationship, or money put behind distribution. That’s why referral traffic is worth benchmarking. Look at the domains sending traffic, the pages visitors land on, and whether that traffic comes from review sites, partners, or media outlets.
Traffic Share
Start by checking which referring domains drive the most traffic. Then look at whether one or two sources carry most of the load.
If referral traffic is packed into just a few domains, that creates dependency risk. It also tells you which partners, publishers, or listings may be worth going after yourself. If the traffic is spread across many domains, the competitor likely has a broader referral base.
Conversion Contribution
Referral visitors often convert at a higher rate because the sending site has already done some of the filtering. A person coming from a review platform or trusted publisher is often farther along in the buying process.
So if a competitor gets a meaningful share of referral traffic from high-authority sources like G2, Capterra, or a respected industry publication, those visitors may be much closer to making a purchase.
"Referral traffic is the most underanalyzed channel. The top referring domains tell you exactly who's sending traffic. Partner sites, review platforms, affiliate programs, media coverage." - Ibby Syed, Founder, Cotera
Landing Page Patterns
Where referral traffic lands matters just as much as where it comes from.
Traffic going to pricing pages, comparison pages, or "vs." pages often signals purchase intent. Traffic going to guides or blog posts usually points to earlier-stage interest. If a competitor keeps getting review-platform traffic to product or conversion pages, those sources are helping close deals, not just send general awareness.
Strategic Signals
Heavy referral traffic from G2 or Capterra suggests a competitor is putting effort into review platform visibility to win buyers who are actively comparing options. Traffic from niche blogs or industry media can point to guest posts, sponsored placements, or PR activity.
A sharp jump in referral traffic may line up with a product launch or press coverage, so it helps to compare those spikes with competitor news.
There’s another angle here too: concentration can be a weak spot. If most referral traffic comes from one or two sources, that competitor is exposed. That gives you a clear read on which review platforms and media outlets to target, while also reminding you not to lean too hard on any single referral domain in your own mix.
Next, compare social traffic to see where attention spreads without a referral link.
sbb-itb-0a8c96a
5. Social Traffic
Social traffic works differently from search. Search is intent-driven. Social is distribution-driven. So if you benchmark social the same way you benchmark organic search, you can end up reading the room wrong.
Traffic Share
If social makes up more than 10% of a competitor's total visits, that's a strong sign they've built a solid social distribution engine.
But total share only tells part of the story. The platform mix matters just as much:
- LinkedIn often points to B2B distribution
- Facebook, Instagram, and TikTok tend to lean B2C
- Reddit can signal community-led growth or Reddit ads
Volume tells you how far the content is spreading. Engagement tells you if that attention is doing anything useful.
Conversion Contribution
Social traffic usually comes with lower intent than organic search. That’s why comments, shares, and saves matter more than likes.
A post can pull in attention and still do very little for the business. Shares and saves suggest people found it worth passing along or coming back to. Comments can hint at interest, friction, or buying signals.
Landing Page Patterns
Where social visitors land says a lot.
Traffic going to blog posts or how-to guides usually points to awareness-stage targeting. Traffic landing on category pages or comparison pages suggests product interest. And if social clicks go straight to pricing, trial, or demo pages, the competitor is pushing bottom-of-funnel demand.
The destination page shows whether social is there to build awareness or drive action.
Strategic Signals
Sharp spikes in social traffic often line up with a viral campaign, a new product launch, or a short-term ad push. If a competitor moves from LinkedIn to YouTube over a few months, that can point to a shift in target audience or a new growth stage.
When you see a spike, don’t stop at the traffic chart. Check platform ad libraries to confirm the creative and the offer behind it.
Next, compare email traffic to see whether competitors turn social attention into repeat visits and pipeline.
6. Email Traffic
Email traffic is one of the clearest signs of an owned audience. It shows how well a competitor turns borrowed attention into repeat visits and, in many cases, pipeline.
Traffic Share
If email makes up more than 10% of total traffic, that usually points to a mature subscriber base and a major owned channel.
Conversion and Landing Page Patterns
Where email clicks land tells you a lot. If they go to /pricing, /demo, or /trial pages, the competitor is using email to drive leads and revenue. And if email visitors view more pages per session and stay longer, that often means the audience is high quality and likely tied to conversions.
Email traffic often lands on offers, product updates, or feature pages. That helps you spot the job the program is doing. Traffic to how-to guides suggests nurture content. Traffic to pricing or alternatives pages suggests conversion campaigns.
There’s another clue here too: spread. If email traffic is distributed across lots of feature-specific pages or deep sub-pages, that can point to advanced segmentation or product-led growth tactics. If most clicks land on the homepage, the sends are probably broader and less targeted.
Patterns over time matter more than any single send. One spike can be noise. A repeated pattern tells a story.
Strategic Signals
Email trends can show whether a competitor leans on lifecycle nurture, promotions, or product-led activation.
Steady traffic with low volatility usually points to a mature retention program and automated lifecycle motions. Sharp spikes often line up with a product launch, a seasonal promotion, or a major re-engagement push. A sudden drop may suggest a failed campaign or a move away from email.
| Email Traffic Pattern | What It Signals |
|---|---|
| Steady, consistent traffic | Automated lifecycle and retention sequences |
| Infrequent, large spikes | Reliance on promotional pushes |
| Traffic to many deep-linked pages | Advanced segmentation or product-led growth tactics |
| Homepage-heavy traffic | Broad sends, weaker segmentation |
Use 6–12 months of trend data to tell a real email strategy from a one-off spike. Then compare email against other channels side by side.
How to Compare Each Traffic Source
Comparing competitor traffic sources only works if you judge every channel by the same standards. The simplest way to do that is to use four benchmarks across the board: traffic share, conversion proxy, landing page patterns, and strategic signals. That gives you a clearer read on whether a competitor is pulling in demand, turning that demand into action, or pushing it through other channels.
For conversion proxies, look at commercial intent, spend, and CPC stability. Landing pages help you spot funnel stage. Resource pages usually sit at the top, comparison pages land in the middle, and pricing or demo pages sit near the bottom. Strategic signals are the sharp changes that hint something is happening behind the scenes, like a jump in paid spend, more non-branded organic traffic, or referral spikes from review sites.
For U.S. SaaS benchmarking, stick to U.S.-filtered views and keep your channel groupings the same across the board so the comparison stays clean. Third-party data is modeled, not exact, so focus on share and rank instead of exact visit totals.
"First-party data gives exact numbers only for properties you control. Third-party tools provide estimates."
Now that each channel is defined, compare them through those same four lenses. The table below lays them out side by side.
| Channel | Traffic Share | Conversion Proxy | Landing Page Patterns | Strategic Signals |
|---|---|---|---|---|
| Organic Search | Non-branded share shows discovery; commercial pages show purchase intent | Stronger when rankings lean toward commercial or transactional terms | Pillar pages, blog clusters, comparison guides | Long-term SEO investment and content authority |
| Paid Search | Paid share of voice on high-intent keywords | Very strong when spend stays steady | Dedicated PPC landing pages with clear CTAs | Budget shifts and new messaging tests |
| Direct | Baseline brand strength, though it can be overestimated | Strong for returning users and customers | Homepage-heavy traffic signals stronger brand demand | Brand equity and customer retention |
| Referral | Traffic from external domains such as review sites and partner pages | Strong when traffic comes from comparison and validation sources | Partner pages and review profiles | Partnership strategy and third-party validation |
| Social | Engagement-to-visit ratios on major social platforms | Varies; often stronger for awareness than immediate conversion | Thought leadership posts, webinars, and gated assets | Community-building and platform-specific focus |
| Share of traffic from email | Very strong, but often directional in third-party estimates | Steady traffic suggests mature retention; spikes suggest campaigns | Lifecycle marketing maturity and retention strategy |
Treat Direct and Email as directional because third-party tools often undercount untracked sessions in both. When you standardize the taxonomy, cross-channel gaps are much easier to spot.
Pros and Cons of Benchmarking by Traffic Source
Traffic sources don't all carry the same kind of signal.
Some tell you a lot. Some look useful at first glance, then send you in the wrong direction. So if you're benchmarking competitors by channel, it helps to rank each source by how much noise it can carry.
Here's a simple way to think about it: the more a channel gets mixed with weak intent, bad attribution, or hard-to-copy outliers, the more careful you need to be.
| Traffic Source | Most Useful For | Decisions Supported | How It Can Mislead |
|---|---|---|---|
| Direct | Measuring brand equity and loyalty | Brand awareness and PR spend | Often absorbs dark social and other untracked links |
| Organic Search | Identifying SEO authority and content gaps | Content roadmap and keyword targeting | High volume may sit on low-intent, non-commercial terms |
| Paid Search | Validating commercial demand and high-intent keywords | Ad budget sizing and PPC bidding strategy | High spend doesn't reveal actual profitability or CPA |
| Referral | Finding partnership and backlink opportunities | Outreach, affiliate, and PR strategy | Can be skewed by spam links or exclusive, non-replicable partnerships |
| Social | Assessing brand reach and community fit | Platform prioritization and creative strategy | High engagement doesn't always correlate with sales |
| Benchmarking retention and lifecycle marketing | CRM and newsletter strategy | Hard to measure externally and often absorbed into Direct |
If you had to sort these by noise level, Organic Search and Paid Search usually give the cleanest read on demand and intent. They're not perfect, but they tend to connect more directly to what people are looking for and how close they are to taking action.
Referral sits in the middle. It can point to link wins, partner traction, or PR momentum. But one odd placement, spammy link cluster, or one-off deal can throw off the picture.
Then you get to the messier channels: Social, Direct, and Email. Social can make a brand look huge without showing much buying intent. Direct often turns into a catch-all bucket for traffic that wasn't tracked well in the first place. And Email? It's useful inside your own stack, but from the outside, it's often half-hidden and partly folded into Direct.
That doesn't mean you should ignore noisy channels. It just means they deserve less blind trust. Use them as supporting clues, not the whole case.
Use Competitor Analysis Tool to surface channel-level demand and visibility gaps in a decision-ready format.
Conclusion
Once you’ve reviewed direct, organic, paid, referral, social, and email, the next move is to look at them together, not one by one. Raw visit counts are just the starting line. They don’t tell you what to do next. The numbers that shape decisions are channel mix ratios, branded vs. non-branded splits, landing pages, and intent signals.
Total traffic only means so much. You need to separate brand demand from actual discovery. That’s where channel mix helps. It shows whether growth is earned, bought, or leaning too hard on a single source.
Keep your benchmark set tight. Stick with 5–10 real competitors. Compare share and rank, not exact visit totals. A heavier organic mix often points to stronger earned demand. A heavier paid mix often points to more cost pressure.
Then look for the gaps that matter most:
- Brand demand
- Content authority
- Paid efficiency
- Partner leverage
Those channel gaps help you decide the next move: build brand, fix SEO gaps, test paid terms, or grow referral partners.
FAQs
Which traffic sources matter most to benchmark first?
Benchmark channel mix before you look at raw traffic volume.
Start with organic search. It helps you gauge long-term content performance, site authority, and technical health. It also helps you spot keyword gaps where competitors are picking up demand that you’re missing.
Then look at referral traffic. This can show where partnerships and distribution are coming from, including industry directories, niche blogs, and high-intent platforms.
Compare 3 to 5 relevant competitors, and check third-party estimates against your own first-party data.
How do I judge traffic quality without exact data?
When exact data isn’t available, focus on directional trends and engagement signals instead of raw traffic numbers. Third-party tools can help you spot momentum, seasonality, and shifts in channel mix, but don’t treat those estimates like exact figures.
Look at bounce rate, pages per session, and average session duration. Then sanity-check traffic quality by tracking actions that matter, like lead conversions or product activations.
Competitor Analysis Tool can also show gaps in messaging, demand, and visibility, which makes it easier to decide where to focus growth efforts.
What traffic source mix signals growth risk?
A traffic mix gets risky when too much of your growth comes from a single channel. If that channel takes a hit, your growth can wobble fast. An algorithm update, a market swing, or higher acquisition costs can put you in a tough spot.
A few warning signs tend to show up early. One is heavy paid traffic paired with weak organic reach. Another is high referral traffic that depends on one page or one platform. A third is traffic from broad, high-volume keywords that bring visitors in but don’t turn into conversions.
When you assess traffic quality, don’t get distracted by raw volume alone. Bounce rate and conversion rate tell you far more about whether that traffic is pulling its weight.