
Value-Based Pricing for SaaS: Benchmarking Guide
Set SaaS prices from customer ROI: benchmark competitors, test willingness-to-pay, and design tiers for SMB to enterprise.

Most SaaS teams price the wrong way. If I want a price that makes sense, I start with customer ROI, check that against the market, test willingness to pay, and then build tiers around it.
Here’s the short version:
- I estimate customer value in four buckets: revenue growth, cost cuts, time saved, and risk reduction.
- I use that to set a rough price target, often around 10% to 20% of the outcome created.
- I then compare my offer to the market by normalizing pricing at set account sizes like 10, 50, and 200 users.
- I look past list price and include setup fees, add-ons, feature gates, and usage limits.
- I test buyer price tolerance with Van Westendorp or Gabor-Granger.
- I turn the final range into clear tiers for SMB, mid-market, and enterprise.
- I review pricing every quarter and watch metrics like NRR, ARPA, expansion revenue, and LTV:CAC.
A few numbers stand out. A 1% pricing improvement can lift profit by 11%. Many teams update pricing at least once a year. And if lost deals due to price go above 15%, that can mean the offer and perceived ROI are out of line.
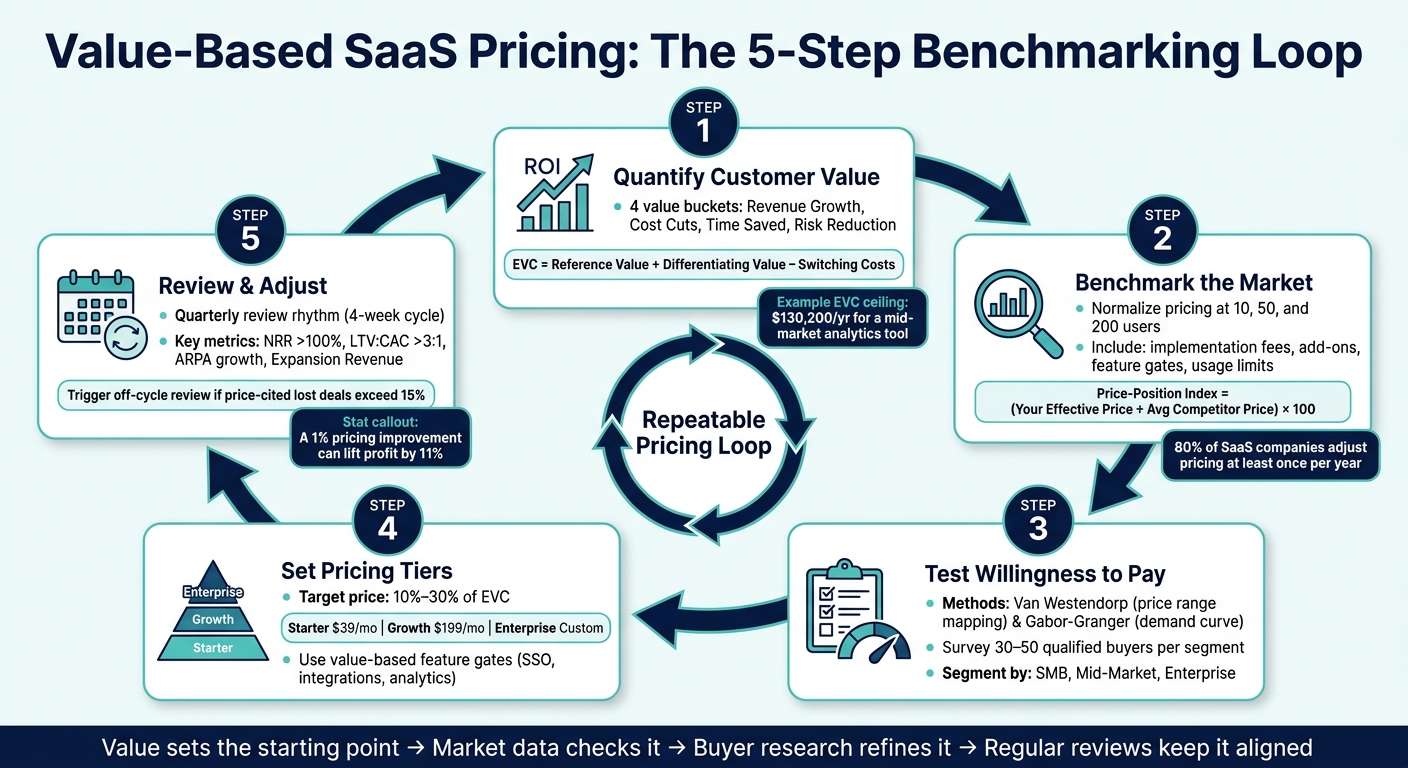
Value-Based SaaS Pricing Framework: 5-Step Benchmarking Loop
Mastering Value Based Pricing for SaaS Products
sbb-itb-0a8c96a
Quick comparison
| Approach | What I anchor price to | Main issue | Best use |
|---|---|---|---|
| Cost-plus | Internal cost | Ignores buyer outcome | Setting a floor |
| Competitor-based | Market price pages | Can turn the product into a commodity | Checking market range |
| Value-based | Customer ROI | Takes more research | Setting price with logic |
So the core idea is simple: value sets the starting point, market data checks it, buyer research refines it, and regular reviews keep it in line.
How to Benchmark SaaS Pricing Against the Market
Market benchmarking isn't about copying a competitor's price. It's about checking whether your price-to-value position still makes sense based on what buyers can get in the market.
Build a pricing benchmark framework before collecting data
Start by choosing the right benchmark set. A solid set usually includes direct competitors (same problem, same segment), indirect competitors (other options buyers may look at), and aspirational competitors (companies in your space with more brand strength or more pricing power).
Before you compare prices, line up similar plans and tiers. That part matters more than people think. If one company's base plan is for small teams and another's is built for larger accounts, a simple side-by-side price check can send you in the wrong direction.
Benchmarking should validate your value estimate, not replace it. Use market data to test your thinking, not to hand over the wheel.
With the right peer set in place, the next step is to normalize plans before comparing prices.
Normalize competitor pricing, packaging, and value metrics
Headline prices almost never tell the whole story. Put pricing into a common unit - usually monthly USD per seat or per usage unit - and compare it at set customer profiles like 10, 50, or 200 users.
You'll also want to account for the stuff that tends to hide in the fine print:
- implementation fees
- onboarding costs
- mandatory add-ons
- feature gates for things like SSO or API access
Here's what a normalized comparison looks like at a 50-seat profile:
| Dimension | Your Product | Competitor A | Competitor B | Competitor C |
|---|---|---|---|---|
| Pricing Model | Hybrid | Per-Seat | Usage-Based | Flat-Rate |
| Entry Price (Monthly USD) | $149 | $99 | $0 (Freemium) | $299 |
| Value Metric | Per Workspace | Per User | Per 1K Events | Unlimited |
| Effective Price (50 Units) | $149 | $4,950 | $250 | $299 |
| Implementation Fee | $0 | $500 | $0 | $2,500 |
| SSO/Security Gate | Mid-Tier | Enterprise | Add-on | Top-Tier |
The effective price column is where the real comparison starts. That's the number you should use to calculate your price-position index: divide your effective price by the average competitor price, then multiply by 100. Track that index every quarter, since 80% of SaaS companies adjust pricing at least once a year.
Once you've normalized prices, look at the story around those prices.
Use website and messaging analysis to find pricing position gaps
Price gaps don't always come from the numbers. Sometimes they come from how the offer is framed.
Outcome-led messaging like "38 hours saved per analyst per month" can support a premium. Feature-led messaging, on the other hand, often nudges buyers into side-by-side price checks. In plain terms, positioning shapes willingness to pay.
A competitor analysis tool can help you spot demand, messaging, and visibility gaps through site comparison. That kind of review can show whether your price gap is actually a positioning gap.
How to Quantify Customer Value and Willingness to Pay
Choose value metrics that scale with customer outcomes
After you benchmark the market, the next step is to put numbers behind each price point.
A value metric is the unit that ties your price to customer value. The best ones are measurable, scalable, tied to the product, and matched to how customers get value.
Common examples include revenue processed for payments, API calls for infrastructure, and resolved tickets for support software. The key is to pick a metric that grows when the customer gets better results, not one that only tracks product usage. That same metric should power both your ROI model and your pricing tiers.
Once you’ve picked the metric, turn its business impact into dollars.
Calculate ROI, economic value, and a realistic price range
The Economic Value to Customer, or EVC, framework gives you a price ceiling. Start with the cost of the next-best option, add the dollar value of what makes your product better, then subtract switching costs. Benchmarking shows the market band. EVC shows the ceiling. Cost sets the floor.
Here’s what that looks like for a mid-market analytics tool:
| Value Driver | Calculation Input | Annual Value |
|---|---|---|
| Reference Value | Incumbent tool cost + analyst time | $68,400 |
| + Time Saved | 12 hrs/wk recaptured × $45/hr | +$27,000 |
| + Revenue Gain | Faster close cycle / reduced slippage | +$40,000 |
| − Switching Costs | Integration + training costs | −$5,200 |
| Total EVC (Price Ceiling) | $130,200/yr |
A common target is 10%–30% of EVC. If EVC is $130,200, that gives you a defendable annual range of about $13,000 to $39,000.
Research willingness to pay without guessing
EVC gives you a logical ceiling. Willingness to pay (WTP) research tells you whether buyers will go along with it. That’s the gut check. Use Van Westendorp or Gabor-Granger to test willingness to pay.
Van Westendorp uses four questions to map the space between "too cheap", "cheap", "expensive", and "too expensive", which helps you find an acceptable price range for each segment. Gabor-Granger shows buyers specific price points and measures purchase likelihood. That helps you build a demand curve and spot the price that brings in the most revenue. For steady B2B results, survey 30–50 qualified buyers per segment.
Don’t lump everyone together. Segment your research by company size and use case. SMB, mid-market, and enterprise buyers often have very different WTP thresholds, even when they’re looking at the same product. Average those groups together, and you blur the picture.
Use the final range to set tier boundaries and package features around the value each segment sees.
Design Pricing Tiers That Reflect Value and Market Reality
Match tiers to customer segments and value drivers
Use your value range and market band to set clear tier boundaries. Take your EVC ceiling and WTP range, then turn them into tiers buyers instantly understand: Starter, Growth, and Enterprise. The point isn’t to invent three random price points. It’s to tie each tier to a clear customer type and the outcome that customer wants to buy.
The features that split tiers should work as value-based feature gates, not random restrictions. Good gates usually line up with how a company grows. That can include security and compliance features like SSO/SAML and audit logs, deeper integrations like Salesforce and HubSpot, and more advanced analytics. Those differences fit naturally with organizational maturity.
Balance economic value pricing with market benchmarks
Benchmark data gives you the frame of reference. When you normalize competitor pricing to a normalized first-year cost, the math can tell a very different story. A $99/month competitor with a $2,000 implementation fee can end up costing more than a $199/month flat-rate option.
That logic is easier to use when you turn it into a simple tier map:
| Tier | Target Segment | Core Value Metric | Monthly Price (USD) | Differentiated Outcome |
|---|---|---|---|---|
| Starter | SMB / Individual | Up to 5 seats | $39/mo | Basic automation & self-service |
| Growth | Mid-Market | Scaled Usage (e.g., 25 seats) | $199/mo | Team collaboration & integrations |
| Enterprise | Large Org | Governance and outcomes | Custom | Security (SSO), SLAs, and compliance |
A premium Enterprise tier also acts as an anchor for the Growth tier. That matters because Growth is usually where you want most buyers to land.
Review and adjust pricing on a regular schedule
Once tiers are live, about 80% of SaaS companies adjust pricing at least once a year. In practice, a once-a-year review often isn’t enough to keep up.
A quarterly rhythm tends to work well. Week 1 is for a data refresh: pull win rates, churn, expansion revenue, and NRR. Week 2 is for segmenting win/loss deals where price came up. Week 3 is for updating the positioning map with a competitive analysis framework and fresh benchmark data. Week 4 ends with a clear recommendation: hold or adjust.
Be direct in that recommendation: keep current pricing or update the mid-tier discovery sequence.
Track the numbers that show whether pricing is doing its job:
- Price-mentioned win rate
- NRR above 100%
- Expansion revenue growth
- CLV:CAC
If win rates drop hard in deals where price was discussed, that usually points to a value articulation issue, not just a price-level issue. It also helps to trigger an off-cycle review after major launches, competitor price changes, or expansion into a new geography.
Conclusion: A Benchmarking Playbook for Value-Based SaaS Pricing
Value-based pricing isn't a one-and-done call. It's a process you can run again and again, and it tends to get better each time. The teams that do this well pair proof of customer value with disciplined market benchmarking, then come back to pricing on a set schedule.
The core steps to take next
Think of the framework as a loop: value, market, willingness to pay, tiers, review.
Start by putting a number on the outcome your product delivers. Then benchmark the market with normalized pricing at 10, 50, and 200 users. After that, check the range with willingness-to-pay testing. From there, set tiers with a clear share of customer value reflected in price. Review pricing every quarter and after major product or market shifts.
What good pricing decisions should improve
Once pricing is live, the job isn't over. You need to see whether it's pulling the right customers into the right tiers.
Watch a few key metrics closely:
- ARPA to see whether customers are moving into higher tiers
- NRR to confirm expansion is outpacing churn
- LTV:CAC to keep unit economics above target; a ratio above 3:1 is generally a strong sign
Also pay close attention to lost deals that cite price. If that figure climbs past 15%, your tiers may not match perceived value.
Strong pricing comes from a repeatable loop: value, benchmark, test, and review. It works when price stays tied to customer value, lines up with market reality, and gets checked on a regular schedule.
FAQs
How do I calculate ROI for my SaaS pricing?
First, put a dollar figure on what your product changes. Tie the outcome to money made, money not spent, or time given back.
That usually comes down to three buckets:
- Revenue generated
- Costs avoided
- Time saved
Use these formulas to estimate annual value:
- Time savings = hours saved per week × hourly labor cost × users affected × 52
- Revenue impact = conversion improvement % × revenue volume affected × profit margin
- Cost avoidance = previous solution cost + implementation cost + ongoing management cost
Here’s the idea: if your product saves a team 5 hours a week, and those hours cost $50 each, and 20 people are affected, that adds up fast over a year.
A common rule of thumb is to price at 10%–30% of the value created.
What’s the best value metric for my product?
The best value metric lines up with your product’s main benefit. And it should grow as your customer’s business grows.
Pick one metric that’s easy to measure, clearly tied to your product, and able to scale over time. Common examples include:
- Users
- Data processed
- API calls
- Transactions
- Hours saved
Stay away from metrics that feel random or that punish customers for getting more value from your product.
When should I update my SaaS pricing?
Review your SaaS pricing every quarter. That gives you enough time to spot patterns without reacting to every little bump in the road.
But when it comes to major pricing changes - like changing your package structure, moving to a new pricing model, or overhauling tiers - keep those to once a year at most. If you change too much, too often, customers get confused. And confused buyers tend to stall.
That said, sometimes waiting doesn't make sense. Take a closer look sooner if you notice clear signs like:
- Low win rates or conversions tied to price
- Market shifts in pricing models
- A gap between your price and the value customers get
- New entrants changing what buyers expect to pay