
Feature Adoption Metrics: SaaS Case Studies
Feature adoption metrics and case studies showing how tracking, targeted onboarding, and role-based campaigns boost SaaS retention and revenue.

Feature adoption metrics help SaaS teams understand if users are not just trying features but making them part of their regular workflows. Why does this matter? Because users who adopt multiple features are much more likely to stick around, boosting retention and revenue. This article breaks down key metrics like adoption rate, activation rate, and retention curves, and shares case studies on how SaaS companies improved feature usage through better tracking, tailored onboarding, and role-specific campaigns.
Key takeaways:
- Adoption vs. Usage: Adoption is about repeated use, not just clicks.
- Core Metrics: Track adoption rate, activation rate, usage depth, retention curves, and revenue impact.
- Case Studies: Examples show how improved tracking and user-specific interventions drive results.
- Revenue Impact: Small adoption improvements can significantly increase retention and revenue.
Understanding and acting on adoption metrics can help SaaS teams improve retention, reduce churn, and increase revenue without needing new customers.
Product analytics 101- feature adoption and retention metrics
sbb-itb-0a8c96a
Core Metrics for Measuring Feature Adoption
Before diving into case studies, it's important to understand the five key metrics that help measure feature adoption. Here's a breakdown of each one:
Feature Adoption Rate
This metric looks at the percentage of eligible users actively using a feature. The formula is:
(Feature MAUs ÷ Total Eligible User Logins) × 100
The keyword here is eligible. Only include users who actually have access to the feature - adding free-tier users, for instance, can distort the results.
On average, the core feature adoption rate for SaaS products is 24.5%, with a median of 16.5%. However, this figure can vary significantly by industry. For example, HR tools tend to see rates around 31%, while FinTech and Insurance products hover closer to 22.6%.
Activation Rate and Time-to-Activation
The activation rate shows how many new users complete a specific "first value" action. The formula is:
(Users who activated the feature ÷ Total new users) × 100
As KISSmetrics Editorial puts it:
"Activation rate is the single most predictive metric for long-term retention."
Another key factor is Time-to-Value (TTV), which measures how quickly users achieve their first meaningful interaction with the feature. Instead of focusing on a single average, analyzing TTV as a distribution highlights whether most users get there quickly - or if a significant number are stuck along the way. This insight can guide improvements before diving into detailed case studies.
Usage Depth and Frequency
Once a feature is activated, the next step is to assess how often users return to it. Breadth measures how many users or teams engage with the feature, while depth focuses on how intensively they use it - how frequently they return and the number of actions they take.
Feature stickiness, calculated as the ratio of DAU (daily active users) to MAU (monthly active users), is another critical indicator of user engagement. For example, B2B SaaS accounts using five or more features per month have retention rates between 92% and 96%, compared to just 60%–75% for those using only one or two features.
Feature Abandonment and Retention Curves
Retention curves track the percentage of users who continue using a feature over time, often at 14-day and 30-day intervals. The curve's shape can reveal a lot:
- A steep early drop followed by a flat line often means users tried the feature out of curiosity but didn’t find lasting value.
- A gradual decline that stabilizes suggests some users formed a habit, even as others lost interest.
It's also important to pinpoint where users drop off. If abandonment happens during a task, it might indicate usability issues or complexity. If users abandon a feature after completing a task and don't return, it could mean the feature didn’t address an ongoing need. A quick micro-survey after inactivity can uncover these underlying reasons.
Revenue-Linked Metrics
The most impactful insights come when adoption metrics tie directly to business outcomes. For example, compare churn rates between adopters and non-adopters of a specific feature. Additionally, track whether adopting a feature leads to plan upgrades or contributes to expansion revenue.
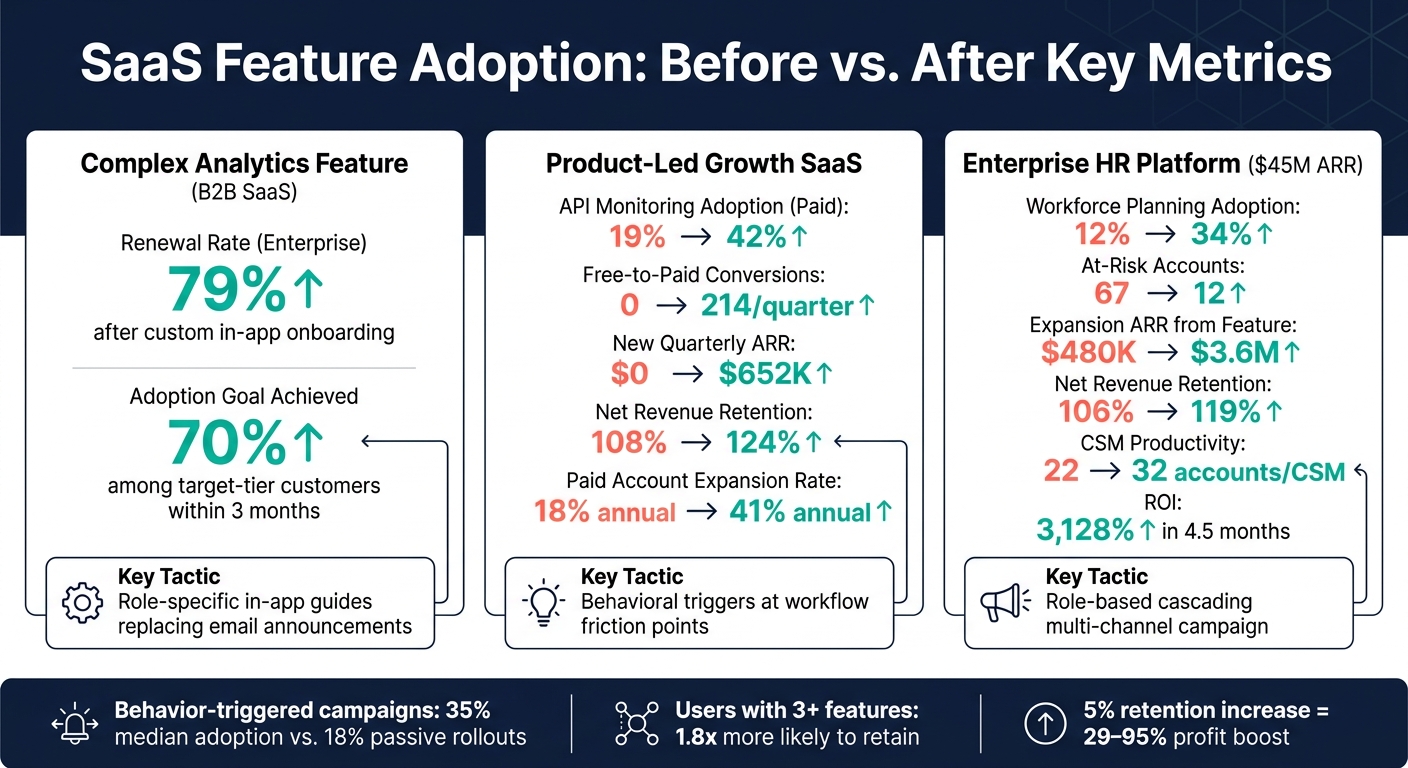
Even small improvements can have a big impact. Increasing customer retention by just 5% can boost profits by 29% to 95%. This makes feature adoption not just a product metric but a key driver of revenue. Understanding these metrics lays the groundwork for exploring practical SaaS case studies in feature adoption.
Case Study 1: Boosting Adoption of a Complex Analytics Feature
Starting Point: Challenges and Baseline Metrics
In the mid-market B2B SaaS world, launching an analytics feature often comes with an uphill battle: adoption tends to stall. One major culprit? Tracking is usually limited to sign-ups and account creation, leaving a gaping hole when it comes to understanding what happens after users onboard. Shockingly, over 40 critical events tied to feature usage often go untracked. Without this data, product teams are left guessing - are users ignoring the feature, abandoning it halfway, or only trying it out once? These blind spots make it impossible to gauge true adoption rates, which often end up underestimating actual usage. The first step to solving this problem was a complete overhaul of event tracking.
Tracking Setup and User Segmentation
Fixing the tracking system was essential for gaining actionable insights. By implementing structured naming conventions like "report_created" or "report_exported", the product team ensured consistency and reliability in funnel analysis. Next, they segmented users based on plan tier and role, ensuring adoption metrics only included those eligible to use the feature. To make the data even more meaningful, users were grouped into four cohorts:
- New users (first 14 days)
- Power users (6+ months)
- Churned feature users
- At-risk accounts
Each cohort was given a tailored activation path with specific first-action goals and onboarding triggers. Gone were the generic tours that many users simply ignored. Instead, the team introduced personalized onboarding experiences to meet users where they were in their journey.
Interventions and Results
Once the new tracking system was in place, the team identified key areas for improvement. For example, Jiminny, a market intelligence platform, tackled these challenges head-on in March 2026. Under the leadership of Head of Product Galya Dimitrova, the team moved away from relying solely on email announcements, which primarily reached admins. Instead, they introduced role-specific in-app guides using Userpilot. These guides segmented flows by role and pricing plan and replaced lengthy, multi-step walkthroughs with quick, single-action tooltips designed to prompt meaningful user engagement.
The results were striking. This strategy led to a 79% renewal rate among enterprise customers who experienced custom in-app onboarding flows. Additionally, the team set an ambitious internal goal: achieve 70% adoption among target-tier customers within three months of launching a feature. They found that users engaging with multiple features were far more likely to stay, proving that improved adoption directly impacts retention rates.
This case highlights how precise tracking and tailored user experiences can transform feature adoption and drive measurable business outcomes.
Case Study 2: Growing Adoption in a Product-Led Growth SaaS
SaaS Feature Adoption: Before vs. After Metrics Across 3 Case Studies
Feature Background and Baseline Adoption
In product-led growth (PLG) models, collaboration features often serve as a strong indicator of long-term user retention. When users begin inviting teammates or sharing their work with clients, the product becomes a core part of their workflow - making churn much less likely. However, getting users to this point is no small feat.
Studies show that in PLG SaaS, around 60–70% of users stick to only 3–4 core features, often unaware of other available tools. The collaboration feature in this case faced a similar issue - not because it lacked value but because it wasn’t visible enough. Tackling this challenge required a series of deliberate, user-focused changes.
Tactics Used to Increase Adoption
To address the low adoption rate, the team started by renaming the feature. What was originally called "External Guests" was rebranded as "Share with Clients." This new name aligned better with how users described their needs, lowering the mental barrier before they even clicked on the feature.
Next, they simplified the permissions system. Instead of a complicated grid of access controls, users were presented with three straightforward options: View only, Can comment, and Can edit. This streamlined approach reduced concerns about data security and made it easier for users to get started.
On the activation side, the team moved away from generic in-app banners and instead used behavioral triggers. These prompts appeared at the exact moment users encountered a workflow limitation, making the feature introduction feel timely and relevant. This shift in timing and context has since become a key driver of PLG adoption strategies in 2026. Together, these tactics paved the way for measurable improvements.
Outcomes and Key Learnings
The results were clear when compared to similar PLG metrics. For instance, a $22M ARR developer analytics platform applied behavioral triggers to promote its premium API monitoring module. Specifically, users who viewed error logs more than three times were prompted to explore the feature. Over nine months, paid account adoption jumped from 19% to 42%, leading to 214 free-to-paid conversions per quarter and $652,000 in new quarterly ARR.
| Metric | Baseline | After 9 Months |
|---|---|---|
| API Monitoring Adoption (Paid) | 19% | 42% |
| Free-to-Paid Conversions | 0 | 214 / quarter |
| New ARR from Conversions | $0 | $652K / quarter |
| Net Revenue Retention (NRR) | 108% | 124% |
| Paid Account Expansion Rate | 18% annual | 41% annual |
These results highlight the power of well-timed, behavior-driven interventions in driving feature adoption. The key takeaway? Activity and adoption are not the same thing. As James Mitchinson, Head of Customer Success at Userpilot, explains:
"A customer can be logging in every day, hitting every event you track, and still get zero outcomes from the product. That customer is not adopted. They're active. The two are not the same."
In the PLG world of 2026, success is no longer about how often users log in or how long their sessions last. It’s about whether they achieve meaningful outcomes and complete key tasks. Teams that focus on tracking the right behaviors - and act on those signals at the right time - are the ones making real strides in retention and growth.
Case Study 3: Enterprise Feature Adoption Through Multi-Channel Campaigns
Adoption Challenges and Segmentation Analysis
In enterprise settings, driving adoption requires strategies tailored to specific roles, unlike the more uniform approaches in product-led growth (PLG) models. These environments often face unique challenges, such as navigating complex organizational structures. Take, for instance, an enterprise HR and workforce management platform with $45M ARR and 280 accounts. Despite its scale, only 12% of users were actively engaging with its AI workforce planning module. This low adoption rate represented a missed opportunity for $4.2M in potential expansion revenue.
A closer look at the analytics revealed a segmentation gap. HR Directors were managing access, but Workforce Planners - the primary users - weren't being reached, and Department Managers lacked a clear path to engage with the feature. Without addressing these role-specific needs, any single campaign would miss key segments of the user base. This highlights the importance of role-based segmentation in enterprise SaaS, where a one-size-fits-all approach simply doesn’t work.
Campaign Design and Execution
To tackle these adoption hurdles, the team developed a role-specific cascading model. Each stakeholder's interaction with the product informed the design of discovery and activation channels. Here’s how the campaign was structured:
| Stakeholder Role | Discovery Channel | Activation Approach |
|---|---|---|
| HR Director (Champion) | Executive email + CSM call | Live demo using account-specific data |
| Workforce Planner (Primary User) | In-app contextual trigger | 5-step interactive walkthrough |
| Department Manager | Automated email from Champion | Pre-built dashboard view |
| Executive Sponsor | Auto-generated QBR slide | 1-click executive dashboard |
One of the key changes was shifting from broad announcements to contextual triggers. For example, Workforce Planners received tooltips during critical workflow moments, seamlessly introducing the feature as a natural solution. Gainsight’s enterprise playbook reinforces this approach:
"The most effective approach uses role-based adoption campaigns that cascade through the organizational hierarchy within each account."
Additionally, automation played a crucial role. When adoption scores for an account dipped below a certain threshold, the system automatically created pre-built talk tracks and account-specific usage data for Customer Success Managers (CSMs). This eliminated the need for time-consuming manual data collection.
These tailored efforts ensured that each stakeholder received messaging and resources aligned with their role, making the campaign far more effective.
Business Impact and Results
The results over 12 months were striking. Adoption of the AI workforce planning module jumped from 12% to 34%. The number of at-risk accounts dropped significantly from 67 to just 12. Expansion ARR tied to the feature surged from $480,000 to $3.6M, and Net Revenue Retention (NRR) improved from 106% to 119%.
| Metric | Before Campaign | After 12 Months |
|---|---|---|
| Workforce Planning Adoption | 12% | 34% |
| At-Risk Accounts | 67 | 12 |
| Expansion ARR from Feature | $480K | $3.6M |
| Net Revenue Retention (NRR) | 106% | 119% |
| CSM Productivity (Accounts/CSM) | 22 | 32 |
Automation also had a significant impact on CSM productivity. By streamlining data collection and talk-track generation, each CSM managed 45% more accounts, increasing their capacity from 22 to 32 accounts. The total investment in the adoption engine was $151,000, but it delivered a net ROI of 3,128% and paid for itself in just 4.5 months.
Using Competitive Insights to Prioritize Feature Adoption
Benchmarking Adoption Against Competitors
Adoption numbers on their own can be helpful, but they don’t tell the whole story. To really understand your performance, you need context. For example, a 24% adoption rate might seem solid - until you realize the industry average for HR tools is 31%. That comparison changes how urgently you might need to address feature improvements.
A good way to approach this is by sorting your findings into three categories: table-stakes gaps (features that competitors offer and buyers see as essential), white-space opportunities (important needs that competitors aren’t meeting effectively), and parity maintenance (areas requiring only minor updates). As Seeto explains:
"A 'No' in a cell is visually identical whether the feature is mission-critical or nobody-uses it. But the cells are not equal weight." - Seeto
Competitor review data can be a goldmine for understanding buyer priorities. Platforms like G2 or Capterra can give you a clear signal: when a feature is mentioned in 20% or more of reviews, it’s likely a buyer-driven feature - something real users rely on daily. Comparing this data to your own adoption metrics can highlight where you’re falling behind on features that actually influence purchasing decisions. To make sense of these gaps quickly, advanced analysis tools can be incredibly helpful.
How Competitor Analysis Tool Surfaces Actionable Insights
One of the biggest hurdles for SaaS teams isn’t a lack of competitive data - it’s how often that data arrives too late. According to Crayon’s 2025 State of Competitive Intelligence Report, 57% of companies admit that competitive insights don’t reach decision-makers in time to shape strategy. By the time you’ve completed your quarterly analysis, competitors may have already taken advantage of a feature gap you overlooked.
That’s where tools like Competitor Analysis Tool come in. This platform compares your website to a competitor’s and delivers actionable insights in under two minutes - no advanced SEO knowledge required. For feature adoption, this speed matters because it helps identify why a feature isn’t gaining traction. Maybe users don’t even know it exists, or perhaps competitors are capturing search traffic with better messaging. For example, if a competitor’s landing page ranks well for a high-intent query about a workflow your product supports, it’s likely a positioning issue rather than a product one. These quick insights can guide you in addressing gaps without unnecessary delays, helping you set smarter adoption goals.
Connecting Competitive Findings to Adoption Goals
Competitive insights are most valuable when they directly inform your adoption strategies. Let’s say your analysis reveals a competitor is actively promoting a self-serve onboarding flow for a feature you already have. This doesn’t mean you need to develop something new - it means you should focus on improving activation and discovery for what you already offer.
A helpful filter to apply is this: “If the competitor didn’t have this, would we still build or promote it for our users?” If the answer is no, the feature likely falls under parity maintenance. It’s worth keeping an eye on, but it doesn’t justify reallocating significant resources. As ideaplan.io warns:
"The purpose of competitive analysis is to inform your product strategy, not to copy someone else's. If you see a competitor launch a feature and immediately add it to your roadmap, you are playing their game." - ideaplan.io
Sometimes, internal metrics alone can’t explain why adoption is lagging. That’s where competitive context - whether it’s a messaging gap, a missing table-stakes feature, or an untapped white-space opportunity - can provide the clarity needed to refine your strategy. Blending competitive insights with internal data ensures you’re not just reacting to numbers but building a roadmap that drives meaningful adoption.
Conclusion: Key Takeaways for Better Feature Adoption
Core Lessons from the Case Studies
One thing is crystal clear from the case studies: passive launches don’t cut it. Companies that use automated, behavior-triggered campaigns see a median adoption rate of 35%, compared to just 18% for those relying on passive rollouts. The difference isn’t the feature itself - it’s the effort teams put into guiding users toward it.
Other key insights emerged as well. First, context is king. Swapping out generic dashboard banners for tooltips that appear exactly when users need them consistently outperformed broad, one-size-fits-all announcements. Second, engagement depth matters: users who interact with three or more features are up to 1.8x more likely to stick around compared to those who only use one. And third, low adoption often stems from missing data - not a flawed feature.
"The most damaging analytics problem isn't bad data. It's missing data. Finding what's absent is usually more valuable than analyzing what's present." - Jake McMahon, ProductQuant
Speed also plays a role. Hitting 20% adoption within the first 10 days correlates with 3.2x higher long-term retention. If a feature isn’t gaining traction in the first two weeks, it’s a sign to take action - not to wait. These lessons provide a roadmap for what comes next.
Next Steps for SaaS Teams
Start by auditing your analytics setup to spot any gaps in your activation funnel. Define a clear "Aha!" moment for each feature and measure it as a specific outcome - not just a basic click.
Then, benchmark your adoption rates. A 24% adoption rate might be great for one product but underwhelming for another. Use competitive data to figure out if the challenge lies in your positioning, discoverability, or the product itself. Pinpointing the right issue ensures your energy is spent solving the right problem.
FAQs
How do I define a feature’s “activation” event?
When defining a feature’s activation event, the goal is to pinpoint the specific actions that indicate a user has experienced the product's core value. These actions should be tied to behaviors that are statistically associated with higher retention rates.
Start by examining what successful users do early on - actions like clicking essential buttons, completing a setup process, or inviting teammates. Then, compare the retention rates of users who performed these actions to those who didn’t. This analysis can reveal patterns that help refine your onboarding process, guiding users to their "aha moment" more quickly and efficiently.
What’s the best way to measure adoption in multi-user accounts?
When it comes to tracking feature adoption in multi-user accounts, focusing on the account level is far more effective than analyzing individual users. Here's how it works: measure adoption by calculating the percentage of accounts where at least one user - or a set minimum number of users - actively engages with the feature. This approach helps you understand if the feature has become a part of the organization's regular workflow.
To boost adoption rates, consider using tools like competitive analysis. These can highlight opportunities to improve your messaging or increase the feature's visibility, paving the way for growth and better integration into users' routines.
How can I tie feature adoption to revenue impact?
To link feature adoption directly to revenue impact, keep an eye on metrics like Revenue-Weighted Feature Usage (RWFU). This metric tracks the percentage of revenue coming from accounts actively using a particular feature. Dive deeper by comparing retention and expansion rates between users who adopt the feature and those who don’t. These comparisons can highlight which features deliver the most value. With this information, you can focus on experiments that transform product features into clear contributors to NRR and ARR growth.