
Landing Page Conversion Benchmarks by SaaS Funnel
Benchmarks for SaaS homepage, demo, free-trial, and pricing page conversions, with guidance on intent, friction, traffic, and deal-size fit.

Not all SaaS landing pages should convert at the same rate. In most B2B SaaS funnels, homepage conversion sits around 1.4% to 2.5%, demo pages often land at 1.5% to 4%, free trial pages usually hit 4% to 10%, and pricing pages average about 3.8%.
If I were judging page performance, I wouldn’t look at raw conversion rate alone. I’d look at intent, friction, traffic source, sales motion, and deal size. A lower-converting demo page can still beat a higher-converting homepage if the leads are closer to pipeline. And a pricing page with transparent pricing may get fewer form fills but send more sales-ready leads downstream.
Here’s the short version:
- Homepage: broad traffic, lower intent, lower direct conversion
- Demo page: fewer conversions, but stronger sales intent
- Free trial page: highest signup rates in self-serve funnels
- Pricing page: high buyer intent, but results depend a lot on pricing visibility
- Main pattern: the more intent a visitor has, the more friction they will accept
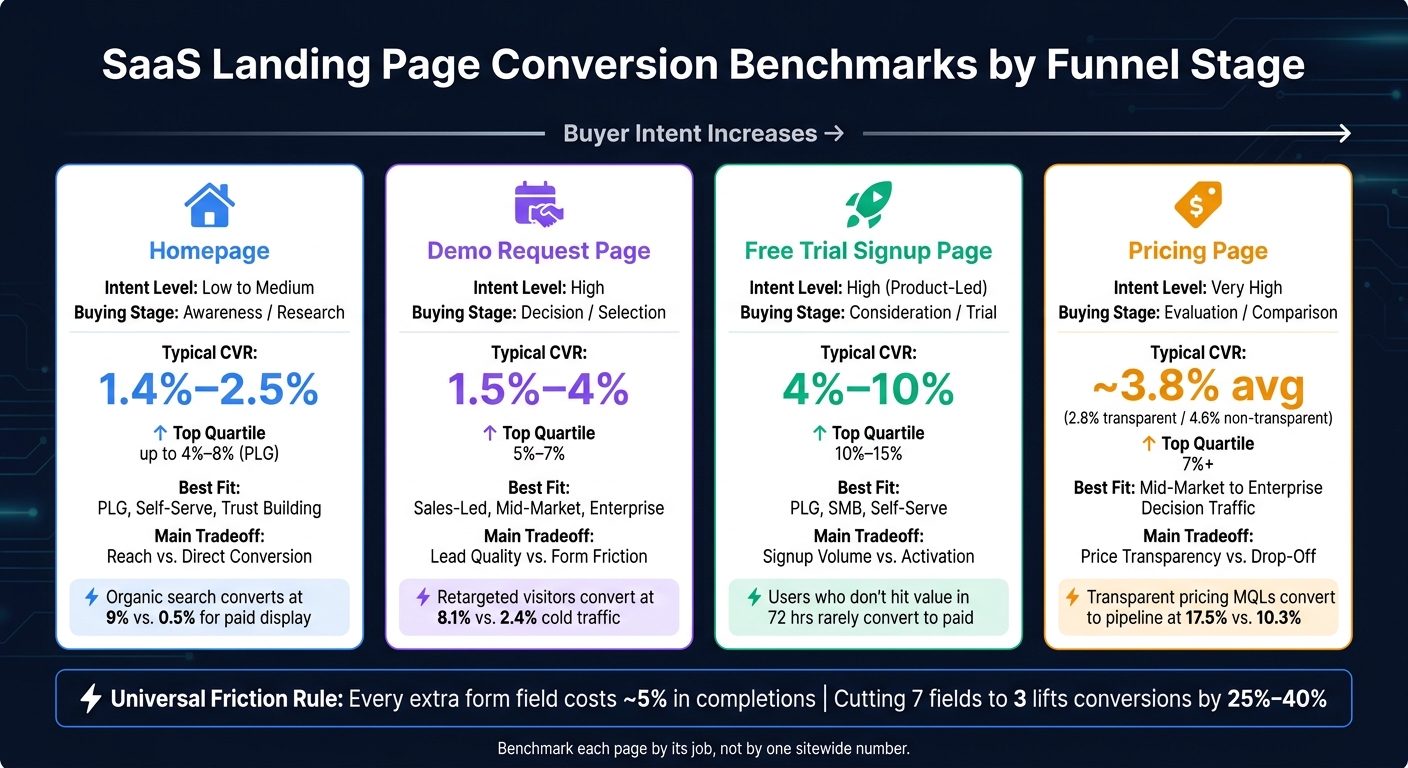
SaaS Landing Page Conversion Benchmarks by Funnel Stage
Quick Comparison
| Page Type | Intent | Typical CVR | Best Fit | Main Tradeoff |
|---|---|---|---|---|
| Homepage | Low to medium | 1.4%–2.5% | PLG, self-serve, trust building | Reach vs. direct conversion |
| Demo Request | High | 1.5%–4% | Sales-led, mid-market, enterprise | Lead quality vs. form friction |
| Free Trial | High | 4%–10% | PLG, SMB, self-serve | Signup volume vs. activation |
| Pricing Page | Very high | ~3.8% | Mid-market to enterprise decision traffic | Price clarity vs. drop-off |
What this tells me is simple: benchmark each page by its job, not by one sitewide number. That frame makes the rest of the article much easier to read.
sbb-itb-0a8c96a
1. Homepage
The homepage is often where people first analyze your website to figure out what your product does. Because of that, intent is usually lower here than on more focused pages. Most homepage visitors are still in evaluation mode. You see that same pattern more clearly on demo, trial, and pricing pages, where intent goes up and the type of friction changes.
Visitor-to-Conversion Rate
If you look at traffic quality alone, homepages usually lag behind dedicated landing pages. The median conversion rate for a general SaaS homepage is about 2.35%, while dedicated landing pages average 4.02%.
A site-wide conversion rate of 2% can also blur what's happening underneath. Traffic sources often behave very differently. For example, organic search visitors may convert at 9%, while paid display traffic can land at around 0.5%.
Friction Level
Homepage friction is mostly about clarity, not forms. People should grasp the value proposition within five seconds. If that takes too long, they bounce.
Forms should also stay short. Every extra field cuts completions by about 5%. And mobile speed can't fall behind desktop. If the experience feels clunky on a phone, you'll lose people before they even think about signing up. As intent gets stronger, those same visitors may move to a demo, trial, or pricing page with less pushback.
Best Fit by SaaS Motion and Deal Size
The homepage tends to work best as a main conversion page in PLG and self-serve motions , a strategy often prioritized by SaaS founders, where conversion rates often fall in the 4% to 8% range. In those setups, users can move from interest to action without much hand-holding.
For sales-led products, the homepage usually does a better job as a trust hub. It sets the stage, answers basic questions, and sends people to a demo request form, which tends to convert at 1.5% to 4%.
Deal size matters too. SMB SaaS ($5K–$20K ACV) is often a better fit for homepage-driven PLG. Enterprise SaaS ($100K+ ACV) usually sees lower homepage conversion - around 1% to 3% - because the buying process involves bigger committees and longer research cycles.
2. Demo Request Page
Compared with the homepage, a demo page speaks to people who are much closer to buying. These visitors are already open to a sales conversation. At this stage, they’re not asking, “What does this company do?” They’re asking, “Does this fit my team, my budget, and my workflow?” That means the page needs to build trust fast.
User Intent
These visitors are high-intent buyers. Put trust proof above the fold so they can see it right away. On a demo page, lead quality matters more than raw volume.
Visitor-to-Conversion Rate
The median conversion rate for a sales-led demo request page falls between 1.5% and 4%. Top performers can reach 5% to 7%. That’s lower than a self-serve trial page, which usually converts at 4% to 8%.
Why the gap? Simple: asking for a demo usually asks more from the visitor. They’re agreeing to talk to sales, not just click around on their own.
Friction Level
Form length has a big effect on conversion. A 7-field form converts far less than a 3-field form. Cutting a form from seven fields to three can lift completions by 25% to 40%.
A practical minimum is:
- Company name
- Role
Anything deeper can happen during the discovery call.
Mobile UX also plays a big part. Demo forms that aren’t built well for mobile see conversion rates 30% to 40% lower than desktop versions. That’s a steep drop, and it helps explain why demo pages work best for higher-ACV, sales-led motions. If the ask is bigger, some friction is expected.
Best Fit by SaaS Motion and Deal Size
Demo-first funnels make the most sense for sales-led and enterprise motions, especially for higher-ACV products. Buyers in these cases often want a human conversation, plus technical proof, before they move ahead.
So yes, lower conversion is normal here. The tradeoff is that these leads are often more serious. On demo pages, the goal isn’t to chase the biggest number possible. It’s to get the right people into the pipeline.
3. Free Trial Signup Page
If the demo page is for buyers who want a conversation, the free trial page is for buyers who want to try the product on their own. That makes the trial page the clearest self-serve conversion point in the funnel.
User Intent
Free trial visitors are in self-serve evaluation mode. In most cases, they’ve already done some homework, but they’re not ready to talk to sales. So the product needs to show value fast.
Visitor-to-Conversion Rate
A typical self-serve trial page converts in the 4% to 10% range, with top-quartile performers reaching 10% to 15%.
Trial pages usually convert better than demo requests because the ask is lighter. Someone can start using the product without booking time or talking to anyone. Higher conversion here often points to stronger product intent, not just better traffic.
Friction Level
Keep signup as lean as possible: email, company name, and role. That’s the minimum viable setup for most trial pages.
No-card trials tend to get more signups. Card-required trials usually bring in fewer signups, but the leads are often better.
Best Fit by SaaS Motion and Deal Size
Free trial pages work best for self-serve and PLG motions, especially for SMB products priced around $29 to $500 per month.
The product has to prove itself quickly. If users don’t hit core value in the first 72 hours, they rarely move to paid. For larger deals, trials tend to work best when product activation leads into sales-assisted follow-up.
4. Pricing Page
After demo and trial pages, pricing is where intent starts turning into a purchase decision. This is the highest-intent page in the funnel. People land here to compare plans, check usage limits, and weigh price against competitors against what they’ll get.
User Intent
Visitors on pricing pages are in evaluation mode. They’re sizing up tiers, looking for plan limits, and trying to decide whether the cost makes sense.
Visitor-to-Conversion Rate
The average conversion rate for a SaaS pricing page is 3.8%. That can sit below demo pages because many visitors are still shopping around, not ready to commit yet.
Pricing transparency has a big effect here. Transparent pricing pages convert at 2.8%, while non-transparent pages convert at 4.6%. At first glance, that makes non-transparent pricing look better. But that raw number can fool you. Hidden pricing often pulls in curiosity clicks from people who only want to check the price. Transparent pricing does the opposite: it filters for buyers who already know the tool may fit their budget.
That tradeoff shows up in pipeline quality. Transparent pricing MQLs convert to pipeline at 17.50%, compared with 10.31% for non-transparent pages.
So yes, pricing is a strong intent signal. But it isn’t a pure conversion page.
Friction Level and Form Complexity
Keep the path short. Every extra field in a form cuts completions by about 5%, and reducing a form from nine fields to three can increase conversion by 25%.
For pricing-page signup flows, keep it tight:
- Company name
- Role
That’s usually enough. Anything more starts to feel like homework.
Best Fit by SaaS Motion and Deal Size
Your CTA should match your deal size. A low-friction "Start Free Trial" CTA makes sense for SMB SaaS with $5,000–$20,000 ACV. Mid-market products in the $20,000–$100,000 ACV range can usually support either a trial or a demo. Enterprise products above $100,000 ACV usually need "Contact Sales."
Those differences matter when you benchmark pricing pages against the other funnel pages below.
Benchmark Breakdown by Conversion Criterion
User Intent by Page Type
Intent shifts from page to page. So even if two pages post the same conversion rate, they may not be doing the same job.
A homepage usually attracts people who are still in research mode. A pricing page, on the other hand, often pulls in visitors who are much closer to a decision. That’s why benchmark data only makes sense when you read it in context.
| Page Type | Intent Level | Buying Stage |
|---|---|---|
| Homepage | Low to Medium | Awareness / Research |
| Free Trial | High (Product-Led) | Consideration / Trial |
| Demo Request | High (Sales-Led) | Decision / Selection |
| Pricing Page | Very High | Evaluation / Comparison |
You can see that intent gap most clearly in conversion ranges.
Visitor-to-Conversion Rate Ranges
Raw conversion rates need stage context. Traffic source matters too. Branded organic search doesn’t behave like paid social, so page benchmarks should always be read next to channel mix.
| Page / Motion Type | Median CVR | Top Quartile | Key Driver |
|---|---|---|---|
| PLG (Self-Serve Trial) | 4%–8% | 10%–15% | Frictionless signup; no credit card |
| Sales-Led (Demo) | 1.5%–4% | 5%–7% | Qualification copy; social proof |
| Pricing Page | 2.8%–4.6% | 7%+ | Pricing visibility |
Retargeted visitors convert demo requests at 8.1%, compared with 2.4% for cold traffic. That’s a big gap, and it shows how much familiarity changes the outcome.
Most of the spread comes down to effort. The more a page asks from the visitor, the more conversion rate tends to drop.
Friction Level and Form Complexity
Higher-intent visitors will put up with more friction. Lower-intent visitors usually won’t.
That’s why top-of-funnel pages tend to work best with fewer fields, while bottom-of-funnel pages can ask for more qualification details. A simple rule of thumb: each extra field costs about 5% in completions. And when teams cut a form from seven fields to three, completions can jump by 25% to 40%.
In plain English, every field has a price. If the page hasn’t earned that ask, people bounce.
Best Fit by SaaS Motion and Deal Size
Page choice should line up with motion and ACV. If the offer and the page don’t match, performance usually suffers.
| SaaS Motion | Primary Page Focus | Deal Size Fit | Friction Strategy |
|---|---|---|---|
| Product-Led (PLG) | Free Trial / Pricing | SMB / Mid-Market | Low (self-serve, no credit card) |
| Sales-Led (SLG) | Demo / Case Studies | Mid-Market / Enterprise | High (qualified fields) |
| Hybrid | Trial + Demo Option | All Segments | Tiered (progressive profiling) |
PLG motions tend to lean on low-friction trial and pricing pages. Sales-led teams usually get more from demo pages and proof-heavy content, especially when deal sizes are larger. Hybrid models sit in the middle, giving visitors a self-serve path and a sales path based on where they are in the journey.
Those fit differences are the tradeoffs reviewed below.
Pros and Cons of Each Funnel Page Type
These pages don't differ that much in layout. What changes is intent, friction, and the kind of conversion each page is built to get. The benchmark ranges above show the numbers. This section gets into the tradeoffs behind those numbers.
Homepage Pros and Cons
At the top of the funnel, the homepage has to orient people before it can convert them. It usually gets the most traffic on the site. Its job is to explain why your product matters and help visitors who are still figuring out what you do.
That broad role comes with a cost. A homepage often has many paths, many messages, and many calls to action. People can click in all sorts of directions, which waters down conversion. Intent is also usually low at this stage. That makes the homepage a better fit as a trust hub for sales-led motions, and a main conversion page for PLG.
Demo Request Page Pros and Cons
Further down the funnel, demo pages give up volume in exchange for better lead quality. They tend to attract people who are already close to making a buying choice.
The catch is friction. Asking someone to book a demo is a big ask, so plenty of visitors drop before converting. Still, the people who do convert often show stronger intent. That's why demo pages work well for sales-led and enterprise motions, where lead quality matters more than raw signup count.
Free Trial Signup Page Pros and Cons
Trial pages do well because they offer speed and independence. People can get started without waiting on a sales rep, which makes this page type a strong match for self-serve motions.
But the risk shows up later. If users don't hit a core value moment in the first 72 hours, they rarely convert. So while trial pages can drive a lot of signups, paid conversion depends heavily on activation. They fit PLG and self-serve motions best, especially when the product can show value fast.
Pricing Page Pros and Cons
Pricing pages sit closest to the purchase decision, so even small trust gaps can hit hard. These pages usually attract the highest-intent visitors on the site.
The big variable here is transparency. Transparent pricing pages convert to pipeline at 17.5%, compared with 10.3% for non-transparent pages. That's a big gap. At the same time, pricing pages can trigger fast exits when the price doesn't match what the visitor expected. Hidden pricing may delay that drop-off, but it often gives up pipeline quality in the process.
In practice, each page works best when it's tuned for a different conversion goal.
| Page Type | Key Advantage | Key Disadvantage | Main Tradeoff |
|---|---|---|---|
| Homepage | Maximum reach | Diluted CTAs; low direct intent | Reach vs. conversion |
| Demo Request | High buyer intent; strong qualification | High friction; many visitors drop | Qualification vs. friction |
| Free Trial | Self-serve scalability | Low trial-to-paid conversion | Signup volume vs. activation |
| Pricing Page | Highest-intent traffic; stronger pipeline | High sensitivity to price expectations | Transparency vs. drop-off |
Conclusion
A single benchmark won't tell you much on its own. Homepage, demo request, free trial, and pricing pages each serve a different role in the funnel, so conversion rates only make sense when you read them alongside the funnel model, traffic source, and what happens after the click.
The benchmark only matters when it lines up with the page's job. A 5% trial-to-paid rate can be healthy in PLG, but weak in a sales-assisted funnel.
As buyer intent gets stronger, pricing pages matter less for signup volume and more for purchase readiness. So a pricing page with a 3.8% conversion rate might not look impressive at first glance, but it often brings in the highest-intent visitors. Transparent pricing pages also convert MQLs to pipeline 1.7x better than non-transparent pages.
Use Competitor Analysis Tool to compare messaging, visibility, and demand gaps against the competitors your buyers actually evaluate. Then benchmark by traffic source, MQL-to-SQL rate, and activation. Judge each page by the metrics tied to its role, and optimize for qualified downstream conversion, not raw page CVR.
FAQs
Which SaaS page should I benchmark first?
Benchmark your free trial page first.
In B2B SaaS, self-serve free trial pages often convert at around 4%–10%. They also tend to beat demo or request pages, mostly because the ask is smaller and users can get value right away.
If your company is sales-led, benchmark the demo-request page next. Dedicated demo pages often convert at about 1.5%–4%.
How do traffic sources affect page conversion rates?
Traffic sources shape conversion rates because they bring in people with different levels of intent, brand awareness, and willingness to act.
Organic search often drives the highest conversion rates, especially for branded keywords. Those visitors usually know what they want, and in many cases, they already know your brand.
Paid display and social traffic often convert at lower rates because the audience is colder. You’re not always reaching people who were actively looking for you in that moment.
Retargeted visitors usually convert best. Why? Their earlier visits and interactions are a strong signal that they were already interested before coming back.
Should I optimize for signups or pipeline quality?
Yes - if your goal is pipeline quality, not just signup volume.
The main thing to watch is whether signups are qualified and whether they get activated. That means your denominator should be qualified visitors, or users who reached core value, not just everyone who landed on the site.
From there, tighten up the first-session experience and the sign-up flow. If people hit friction early, the numbers can look fine on the surface while the actual buyer quality slips.
It also helps to watch the trial-to-paid stage as a quality check. If conversion is high but early churn is also high, you’re tuning the wrong metric. In that case, put more weight on trial-to-retained than on trial-to-paid alone.