
Ultimate Guide to Competitor Ad Budget Analysis
Estimate rivals' ad spend by channel using search clicks, CPCs, ad-library signals and 6–12 months of trend data.

You can't see a competitor's exact ad budget. But you can estimate enough to make better spend calls. I’d use search click volume + CPC, ad library run time, and 6–12 months of trend data to sort rivals into low, base, and high budget ranges.
Here’s the short version:
- If a rival keeps ads live for 30+ days, that often means the ads are working.
- If paid search tools show 39,000 clicks at $3.20 CPC, that points to about $124,800/month before any adjustment.
- For search, I’d often take third-party estimates and apply a 1.3x to 1.5x factor.
- For social, display, and video, I’d look at active ad count, run length, and channel spread to judge if a company is testing or spending at scale.
- I’d check three sources minimum before moving budget.
- Then I’d end with one clear action: what I will change this month.
This article comes down to one idea: I’m not looking for a perfect number. I’m looking for a useful range. That range helps me decide where auctions are too expensive, where rivals are pulling back, and where better landing pages or sharper messaging can beat a bigger budget.
If I were doing this today, July 3, 2026, I’d keep the process simple:
- Build low, base, and high spend estimates by channel
- Split branded vs. non-branded search terms
- Watch for CPM jumps above 20% and CTR drops above 15%
- Review light signals monthly and do a deeper budget check each quarter
| Channel | What I’d check first | What it tells me |
|---|---|---|
| Paid search | Click estimates, CPC, keyword spread | Search budget pressure |
| Paid social | Live ads, run dates, format mix | Test vs. scaled spend |
| Display/video | Ad volume, placements, video use | Budget depth across channels |
| Landing pages | Page count, message match, offer focus | How well spend may convert |
| Public filings | Total marketing spend | Top-line context only |
Read this as a decision guide, not a finance report. The goal is to estimate where money is going, spot shifts early, and move your own budget with more confidence.
This ONE TOOL Sees ALL Your Competitor's Ads (and Spend!)
sbb-itb-0a8c96a
The Main Data Sources for Estimating Competitor Ad Budgets
Use a few sources, then cross-check them until the numbers start telling the same story. A good way to do this is to start with platform signals, then check them against traffic data and public filings.
Platform Signals from Search and Social Ads
Your own Google Ads Auction Insights report is one of the best places to begin. It shows impression share, overlap rate, and how often a competitor outranks you. If you read it the right way, it gives you a clear view of relative pressure inside your auctions, even though it doesn't show an exact budget.
On the social side, the Meta Ad Library, LinkedIn Ad Library, and TikTok Creative Center can tell you a lot. You can count active creatives, check run dates, and see which formats a competitor keeps using. The key is to look at how long ads stay live, not just how many there are. Ads that run for 30+ days usually point to steady spend, and a growing number of active ads from one month to the next often suggests a bigger budget.
Use those signals to figure out which channels are worth a deeper spend estimate.
Traffic, Keyword, and Landing Page Signals
Tools like Semrush and SpyFu can help you estimate a competitor's paid keyword coverage, average CPCs, and monthly traffic cost. For example, 39,000 monthly PPC visits at a $3.20 CPC suggests about $124,800 per month in search spend.
When you pull keyword data, split branded and non-branded terms apart. Branded spend often points to defense and retention. Non-branded spend is usually a better stand-in for acquisition intensity, which matters more when you're trying to see how hard a competitor is pushing for new customers.
Landing pages also give away a lot. High-spend competitors usually don't send paid traffic to their homepage. If they have several dedicated landing pages, each built for a different audience segment or ad angle, that's a sign of a more mature campaign setup and a higher level of investment.
Use financial filings only as a sanity check for the total. They aren't a good way to estimate channel-level spend.
Public Financial Data and Website Gap Analysis
For larger or publicly traded SaaS companies, SEC filings, earnings calls, and investor materials can give you directional context on total marketing spend. These sources won't break spend down by channel, but they can help you check whether your bottom-up estimate looks reasonable.
Competitor Analysis Tool lets you compare your site against a competitor's to spot demand, messaging, and visibility gaps. Those gaps often explain why budget gets pushed into one channel over another. It runs in under two minutes and doesn't require SEO expertise.
Use this quick map to match each source to the type of estimate you need.
| Data Source | Best For | Monthly USD Estimate? |
|---|---|---|
| Google Ads Auction Insights | Competitive pressure in your own auctions | Indirectly |
| Meta / LinkedIn / TikTok Ad Libraries | Creative volume, longevity, format signals | Yes, with CPM modeling |
| Semrush / SpyFu | Paid keyword coverage, traffic cost estimates | Yes - strongest path |
| Website / landing page analysis | Funnel investment and audience segmentation | Indirectly |
| Public filings / investor materials | Total marketing spend context for large SaaS | Context only |
| Competitor Analysis Tool | Demand, messaging, and visibility gap analysis | Indirectly |
How to Estimate Competitor Ad Spend by Channel
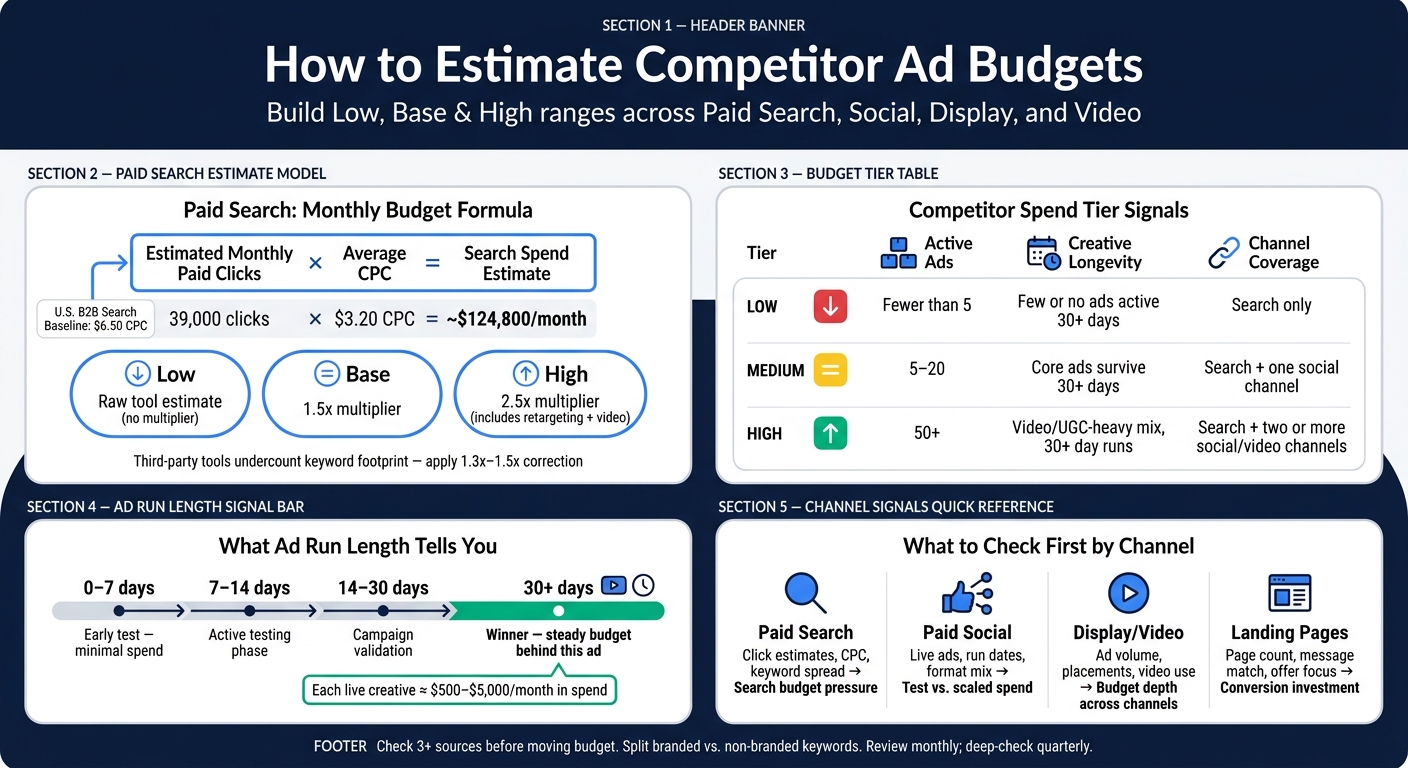
Competitor Ad Budget Tiers: How to Estimate Rival Spend by Channel
Once you have the public signals, the next step is to turn them into channel-level spend ranges. Keep it simple: build a low, base, and high estimate for each channel.
Paid Search: Build a Monthly Budget Estimate from Keyword Coverage and CPCs
For paid search, the easiest starting point is:
estimated monthly paid clicks × average CPC
A solid working baseline for U.S. B2B search is $6.50 CPC.
That said, third-party tools almost always miss part of the keyword footprint. So if you're using a tool-based estimate, multiply it by 1.3x to 1.5x to get a more middle-of-the-road view.
It also helps to split branded and non-branded terms. Branded keywords tend to protect demand that's already there. Non-branded keywords tell you more about acquisition pressure and how hard a competitor is pushing for net-new pipeline.
Don't judge based on a single month. Pull at least 6 to 12 months of data so you can tell the difference between a real strategy change and a seasonal push, short campaign burst, or product launch spike.
Paid Social, Display, and Video: Use Ad Volume, Reach Signals, and Creative Duration
Search gives you the cleanest floor. Social, display, and video are messier, so your range needs to be a bit wider.
The main thing you're trying to figure out is simple: are they testing, or are they scaling?
A good rule of thumb is that each live ad creative often maps to about $500 to $5,000 in monthly spend. More active creatives usually point to more spend. And if ads stay live for 30+ days, that's one of the clearest signs that the account is putting money behind winners.
By contrast, short run times of 7 to 14 days usually look more like testing.
Use those signals to sort competitors into rough spend tiers when exact numbers aren't available.
| Tier | Active Ads | Creative Longevity | Channel Coverage |
|---|---|---|---|
| Low | Fewer than 5 | Few or no ads active for 30+ days | Search only |
| Medium | 5–20 | Core ads survive 30+ days | Search + one social channel |
| High | 50+ | Video/UGC-heavy mix | Search + two social/video channels |
Creative format matters too. A move from static images into video or UGC usually points to a higher-spend phase. It often means more money is going not just into media, but into production as well. And if a competitor has moved beyond Meta into TikTok or YouTube, that's usually a real budget move, not a small test.
A Simple Model for Building Low, Base, and High Budget Ranges
When the exact spend is hidden, don't force a single number. Use a range instead.
- Low estimate: Use the raw "Traffic Cost" or spend figure from your tool with no multiplier.
- Base estimate: Apply a 1.5x multiplier to the low estimate, or use the midpoint across two or three tool estimates.
- High estimate: Multiply the low estimate by 2.5x to account for retargeting, multi-placement buys, and high-frequency video views.
For social and display, build the low estimate from active ads, run length, reach, and CPM. Then use the range to compare competitors against each other, not to pin down an exact media bill.
"The estimate will never be exact, but it does not need to be. You need it to be accurate enough to inform budget conversations, identify strategic shifts, and spot when a competitor dramatically increases or decreases their paid media investment." - OSCOM Market Intelligence
At the top end, watch for a few signals happening at once: heavy video or UGC use, expansion into 3+ platforms, and strong impression share on expensive category keywords. Those are the moments that usually tell you a competitor isn't just dabbling - they're pushing hard. Use the tier read in the next step to decide where your own budget may need to move.
How to Use Competitor Budget Data to Reallocate Your Own Spend
Knowing what a competitor spends only matters if it changes what you do next. The point isn't to mirror their channel mix. It's to spot the places where your budget can work harder than theirs.
Where to Compete Directly and Where to Avoid Expensive Auctions
Use the low, base, and high estimates from the last section to decide where to defend, where to push, and where to back off.
One of the clearest signs to avoid a channel is when several competitors are pushing the same message with heavy spend. If you see 20+ rivals leading with "50% off" or "cheapest plan" on the same keywords, you're looking at a low-margin auction. Jumping in with the same budget and weaker creative doesn't help. It just burns cash faster.
"Matching budget with inferior creative accelerates losses." - Larry, AdLibrary.com
The clearest sign to compete head-on is when ad volume is dropping or activity is shrinking to fewer platforms. That often means growth has slowed or margins are getting squeezed. And that can give you a short window to put more into acquisition while the pressure is lower.
If you're bidding on competitor terms, be selective. Only bid when the auction makes sense and the intent is high. Put spend into three bottom-of-funnel keyword clusters:
- "[Competitor] pricing"
- "[Competitor] alternatives"
- "[Competitor] reviews"
These searches usually come from buyers who are already thinking about switching.
Use Messaging and Visibility Gaps to Guide Budget Shifts
Once you've looked at budget levels, check the landing experience behind each campaign.
Budget patterns show where a competitor is spending. Pair that with a landing page and messaging review, and you can start to see how well that spend is turning into conversions. That's often where the best opening sits.
A common gap is heavy spend going to a generic homepage. If you can send traffic to a tailored landing page instead, that's often a better place to move budget. You can also shift messaging toward the angle competitors are leaving open.
Competitor Analysis Tool can help you spot these gaps fast. It compares your site against a competitor's and flags demand, messaging, and visibility gaps without requiring SEO expertise. That makes it easier to decide where added spend can support an opening your competitors aren't covering.
Set a Monthly and Quarterly Monitoring Cadence
Competitor budgets change, so your review process should too. For most SaaS teams, a simple two-tier cadence works well.
Each month, do a light check for new ad launches. Watch for CPM spikes above 20% or CTR drops above 15%. Those shifts often mean a competitor has put in more budget or launched stronger creative, and they're worth catching early before they hit your pipeline.
Each quarter, do a deeper review tied to your normal budget reset. Use that review to update spend tiers and channel priorities. The monthly checks should feed into the next quarterly allocation.
Conclusion: Make Better SaaS Budget Decisions Using Competitor Spend Estimates
Once you’ve built your low, base, and high ranges, the next move is simple: use them to make budget calls.
You’re not going to find an exact competitor budget sitting out in public. But you can get estimates that are good enough to act on. Channel signals, keyword coverage, and ad library data give you enough direction to make confident allocation choices without getting hung up on an exact dollar amount.
That’s where these ranges help. They show you which auctions are worth stepping into, where better creative can beat a bigger budget, and which channels competitors may be leaving underfunded. Long-running ads usually point to ads that are working.
Before you change your budget assumptions, check at least three sources. Then pair that with a visibility and messaging gap review. Competitor Analysis Tool can surface demand and messaging gaps fast, which helps you move from raw spend data to actual allocation decisions.
Use the estimate to decide where to shift spend, not just how to report it. End each analysis with one Decision Note: what budget change you will make this month based on what you observed.
FAQs
How accurate are ad budget estimates?
You can’t see a competitor’s exact ad budget because that data isn’t public. If someone claims they know the precise number, they’re almost certainly giving you an estimate, not a fact.
So don’t chase one magic dollar figure. Use a few imperfect sources and piece together a directionally accurate range instead.
Look at spend signals like ad volume, how long the same creatives stay live, and whether the brand is expanding to more platforms. Those clues often tell you more than a single budget estimate ever could.
Which channels are easiest to estimate?
Paid search is usually the easiest channel to estimate because keyword-level data is easy to get. If you look at how many keywords a competitor bids on, their estimated position, and average cost per click, you can build a solid baseline for search spend.
No tool gives exact figures. But if you use more than one source, you can get directionally accurate insights.
How often should I update my estimates?
Update on a set rhythm:
- Daily: 15-minute check-ins for quick observations
- Weekly: two-hour deep dives into trends or content changes
- Monthly: half-day reviews of your dataset
- Quarterly: reviews of your hypotheses and platform expansion patterns
Also make updates whenever new data comes in. Competitive landscapes can shift fast.